Nothing has changed from last time, market remains in downtrend. But for how long will this continue? Is more pain ahead of us? How do we know when real market turnaround is sustainable and not bull trap?
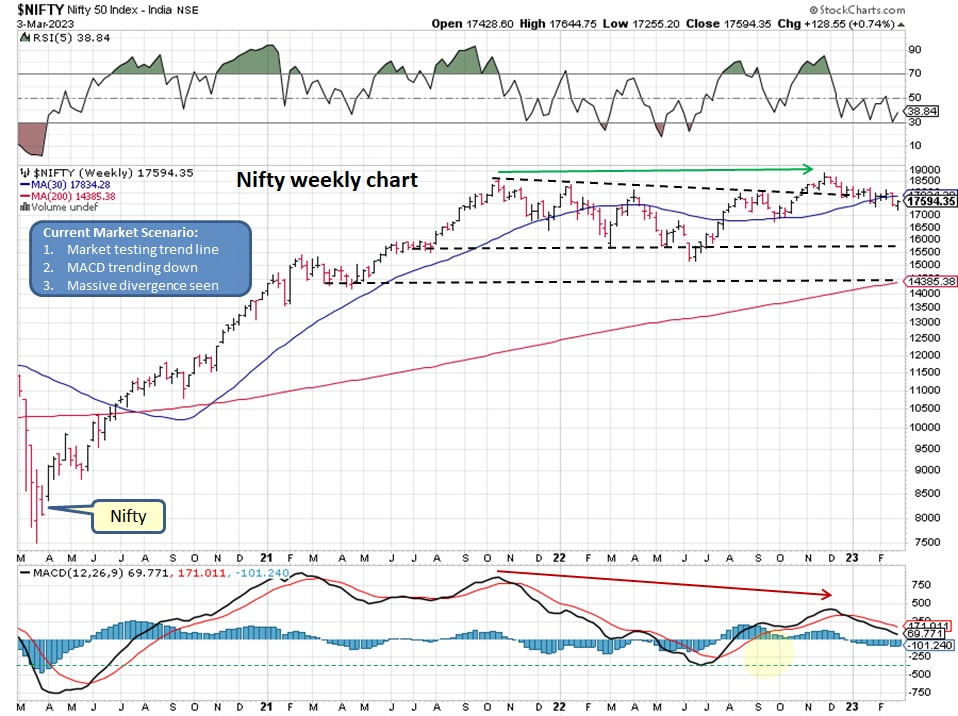
Weekly Nifty chart below shows the divergence formed over a year. MACD is trending down but remains above zero. However, the correction so far remains shallow and appears to be very controlled.
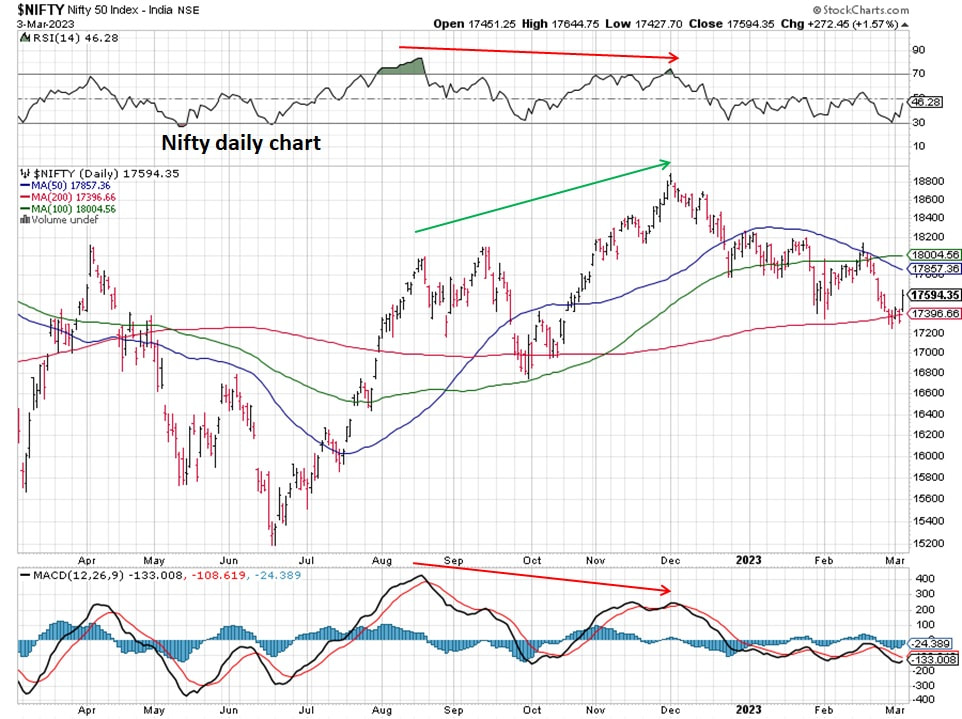
Daily Nifty chart below displays that market is trapped between 50 and 200 moving averages. We could see sideways action for a while.
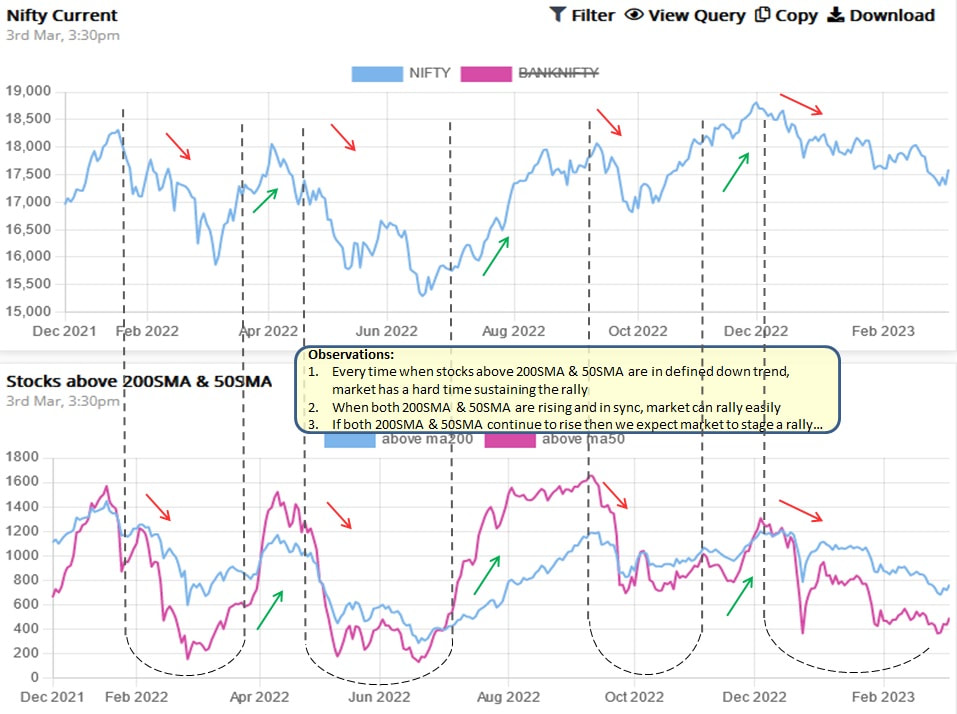
Below chart tells us about number of stocks above 50day and 200day moving averages. As we can see in the lower part of the chart, we might get the turn in coming weeks suggesting more stocks are moving above their respective 50day and 200day moving averages. This will undoubtedly push the market higher, Isn't it!!!
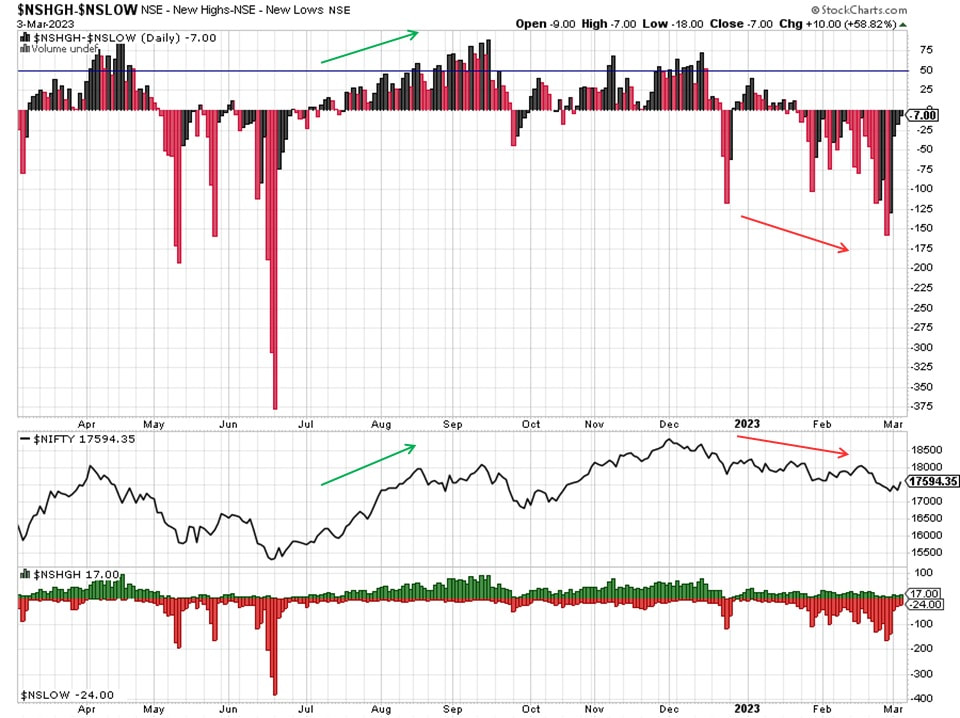
Difference between New Highs & New Lows is another way to look at market internals. As New Lows increases, it is difficult for market to be bullish or even if it is bullish then it will not be sustainable.
Summary:
Market remains in correction mode, be cautious...
- Market remains in down trend for now
- Once market internals (New Highs > New Lows) start improving then we can expect market to turnaround
- In near term, market may remain range bound
Market remains in correction mode, be cautious...

 RSS Feed
