Trend Exhaustion Index & Trend Explosion Index
This was created by Clifford L. Creel.
What is Trend Exhaustion Index (TEI)?
Calculates the ratio of stocks making New Highs divided by Advancing Issues.
The belief is that during bull market, more stocks are making new highs and hence more number of stocks are advancing each day. The calculated ratio would result in a high value of TEI. However, market can't keep going higher forever and as market tops, usually we shall see a shift and decline in number of stocks making new highs. Although in overall market, number of stocks might be making advances but not many new highs. This will cause the TEI to decline which might be useful in determining the character of the market and might signal that market is topping.
What is Trend Explosion Index (TEI)?
Calculates the ratio of stocks making New Lows divided by Declining Issues.
The belief is that during pullback or bear market, more stocks are making new lows and hence more number of stocks are declining each day. The calculated ratio would result in a high value of TEI. However, market can't keep going down forever and as market bottoms, usually we shall see a shift and decline in number of stocks making new lows. Although in overall market, number of stocks might be declining but not many new lows. This will cause the TEI to decline which might be useful in determining the character of the market and might signal that market is bottoming.
How does it help us Identify Market Direction?
We will go through it, step by step below to understand market direction.
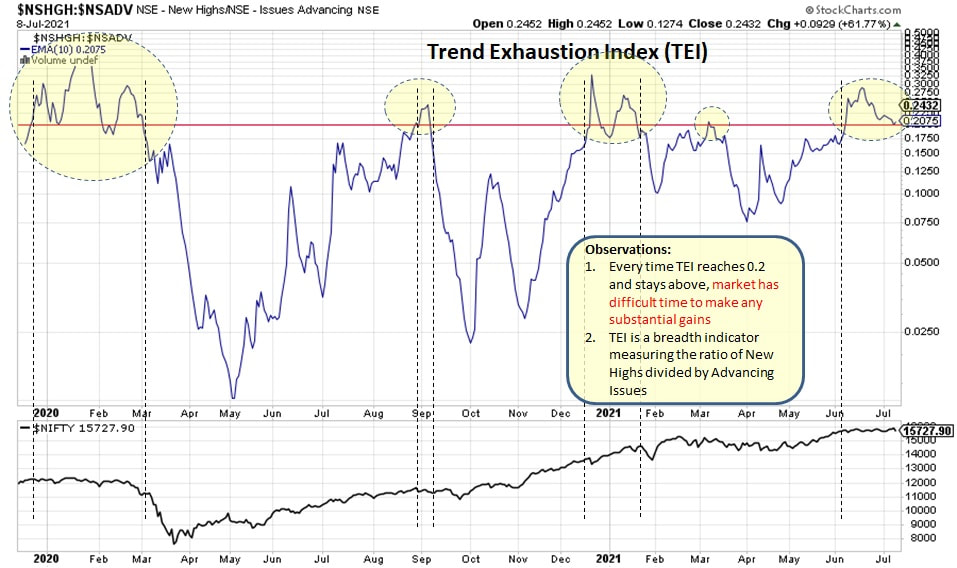
Trend Exhaustion Index
Ratio: New Highs / Advancing Issues
What can we understand from below chart?
Example:
Knowing where TEI is helps us to make better informed decisions in the market.
What can we understand from below chart?
- Every time TEI reaches above 0.2 and stays above, market has hard time to sustain rally
- Usually market tends go sideways or pullback or start of correction
Example:
- 2020 March drop - Before market drop, TEI was above 0.2 and market was not able to make significant advance in prior 2 months
- 2020 Sept mini correction - Before market correction, TEI went above 0.2 for almost 2 weeks
- 2021 Feb correction - Before market correction, TEI was above 0.2 level
- 2021 Mar pullback - TEI slightly tagged 0.2 level suggesting caution
- 2021 Jun sideways - TEI stayed above 0.2 for more than a month
Knowing where TEI is helps us to make better informed decisions in the market.
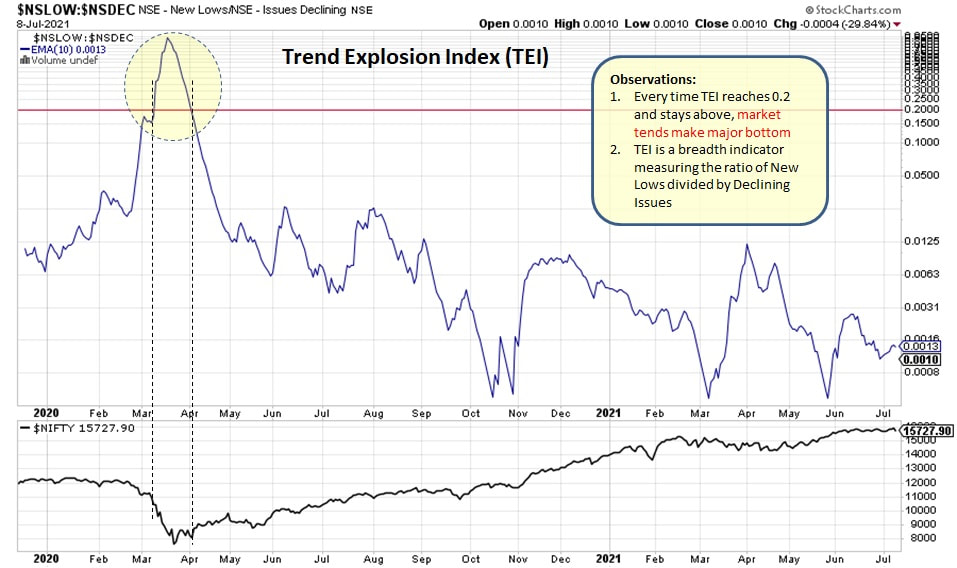
Trend Explosion Index
Ratio: New Lows / Declining Issues
What can we understand from below chart?
Example:
What can we understand from below chart?
- Every time TEI reaches above 0.2 and stays above, market tends to bottom
- Market starts a new rally once TEI drops below 0.2
Example:
- 2020 April/May rally - Before market rally, TEI was above 0.2 and market was appearing to bottom
Remember: TEI is a breadth Indicator used to understand probable market direction.
We can use above breadth indicator as a guide to understand market direction based on simple conclusions:
Current live chart can be viewed below:
We can use above breadth indicator as a guide to understand market direction based on simple conclusions:
- Trend Exhaustion Index above 0.2, time to be cautious - bearish
- Trend explosion Index above 0.2, time to get ready for upcoming rally - Bullish
- No need to jump in the market right away, have patience
Current live chart can be viewed below:
