Advance Decline Line
What is Advance-Decline Line?
Measures the number of individual stocks participating in a market rise or fall, check details here.
There are many ways to use Advancing issues and Declining issues, however our focus will be on one method for now:
- Cumulative Advance Decline Line with exponential moving average
How does it help us Identify Market Direction?
We will go through it, step by step below to understand market direction. If you are interested in understanding how the advance decline line is calculated then read here.
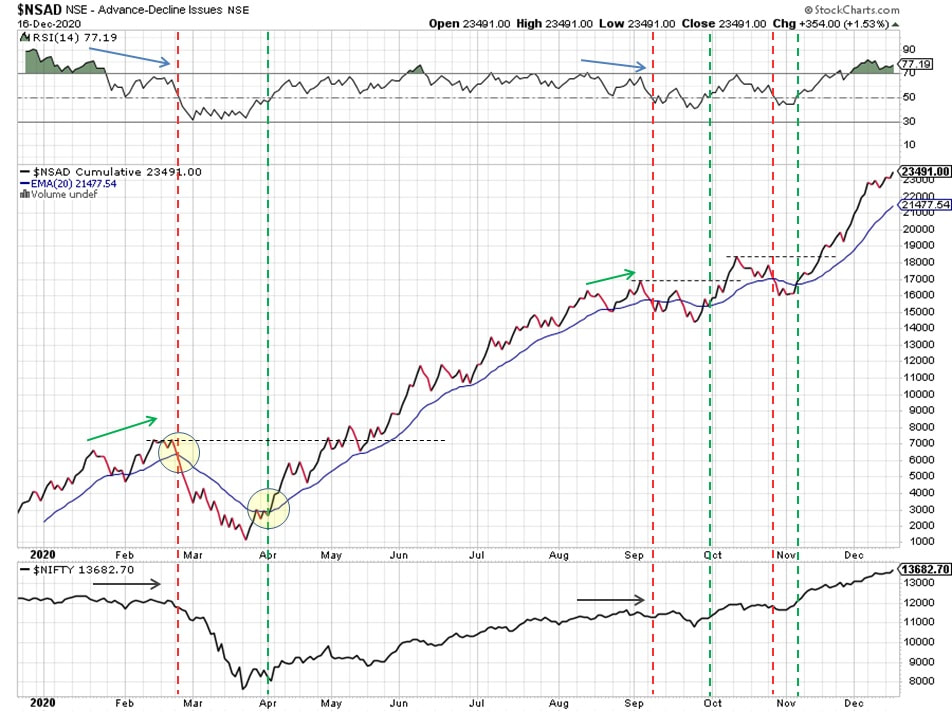
Cumulative Advance Decline Line with exponential moving average
What can we understand from below chart?
Example:
- As long as NSAD (Nifty advance decline line cumulative) remains above EMA(20), market continues to stay healthy
- Every time, NSAD drops below EMA(20), market tends to pullback or go sideways
- Every time, NSAD makes a new high (shown by dotted horizontal line), market tends to follow higher
- Watch how RSI(14) tends to drop below 50 mark suggesting NSAD might drop below EMA(20) which would suggest to be cautious
Example:
- March drop - Before market drop, NSAD had moved below EMA(20) & RSI was well below 50 mark
- Sept mini correction - Before market correction, NSAD was making lower high, occasionally slipping below EMA(20) & RSI was dwindling around 50 mark.
- Oct mini correction - Before market correction, NSAD was making lower high, occasionally slipping below EMA(20) & RSI was dwindling around 50 mark.
We can use above breadth indicator as a guide to understand market direction based on simple conclusions:
Current live chart can be viewed here.
- If NSAD line making new high then market shall follow - Bullish
- if NSAD line staying above EMA(20) then market is in good state - Bullish
- Watch for RSI & MACD line for possible change in market direction
Current live chart can be viewed here.
