Number of Stocks above their 50day SMA & 200day SMA
The number of stocks trading above their specific moving average is a breadth indicator that measures internal strength or weakness in the underlying index. Typically the 50-day simple moving average and 200-day simple moving averages are used to understand the strength of the market.
How does it help us Identify Market Direction?
We will go through it, step by step below to understand market direction.
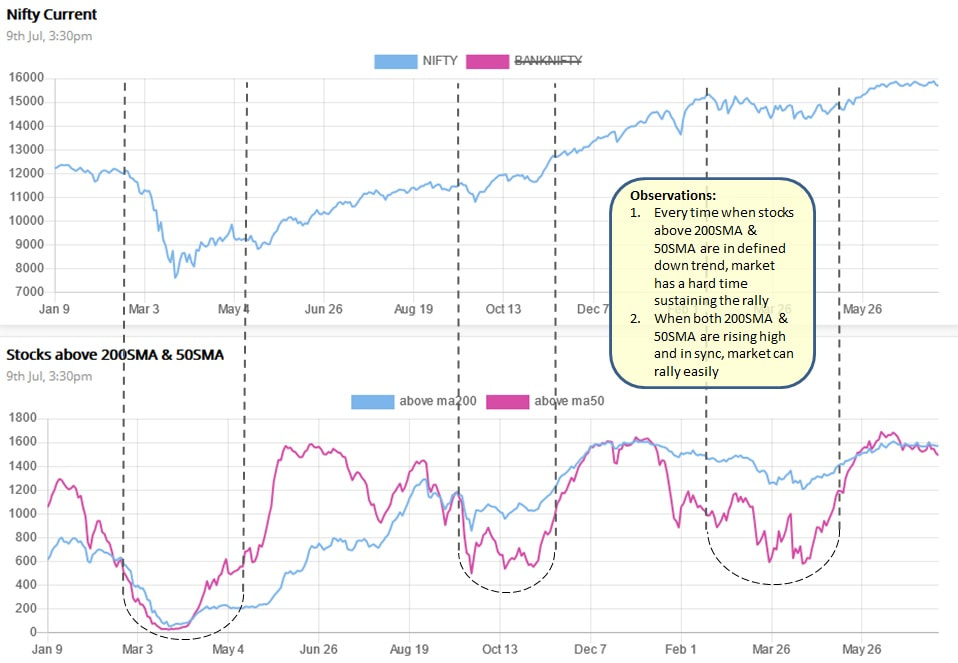
Below image displays 2 charts:
b. purple line - Number of stocks above their 50 day simple moving average
What can we understand from below chart?
Example:
Knowing how many stocks are participating in market rally and market drop helps us to make better informed decisions regarding market direction.
- Top Chart - Nifty daily chart
- Bottom Chart
b. purple line - Number of stocks above their 50 day simple moving average
What can we understand from below chart?
- Every time blue and purple line (Bottom chart) starts trending down or dropping then market (Top chart) has hard time to sustain rally
- Every time blue and purple line (Bottom chart) starts rising or increasing then market (Top chart) can rally easily
Example:
- 2020 March drop - Before market drop, both blue and purple line (Bottom chart) starts to drop which triggers market drop (Top chart).
- 2020 Sept mini correction - Before market mini correction, both blue and purple line (Bottom chart) starts to drop which triggers market sideways action (Top chart).
- 2021 Feb correction - Before market correction, both blue and purple line (Bottom chart) starts to drop which triggers market choppiness (Top chart).
- 2020 May to Aug rally - Both blue and purple line (Bottom chart) are in sync and starts rising which triggers massive rally in market (Top chart).
- 2020 Nov to 2021 Jan rally - Both blue and purple line (Bottom chart) are in sync and rising which triggers rally in market (Top chart).
Knowing how many stocks are participating in market rally and market drop helps us to make better informed decisions regarding market direction.
We can use above breadth indicator as a guide to understand market direction.
Current live chart can be viewed here.
