Market has been grinding sideways for more than two months and frustrating everyone. Let's see if charts are providing any clues regarding future probable direction.
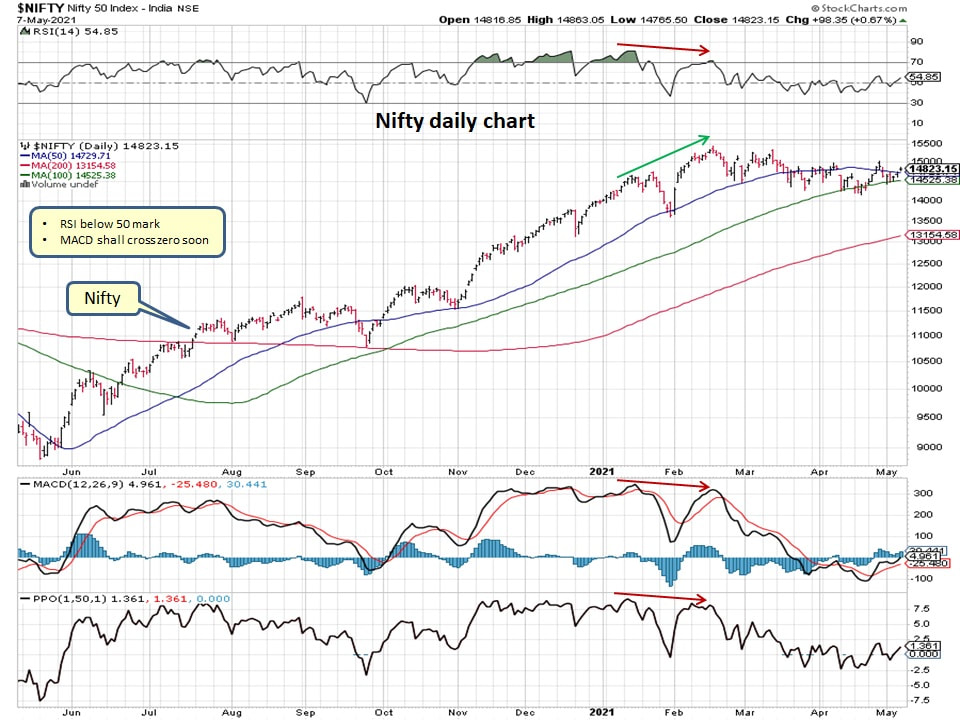
Daily Nifty chart does not provide any particular clue as RSI is right near 50 mark while MACD is also close to zero mark.
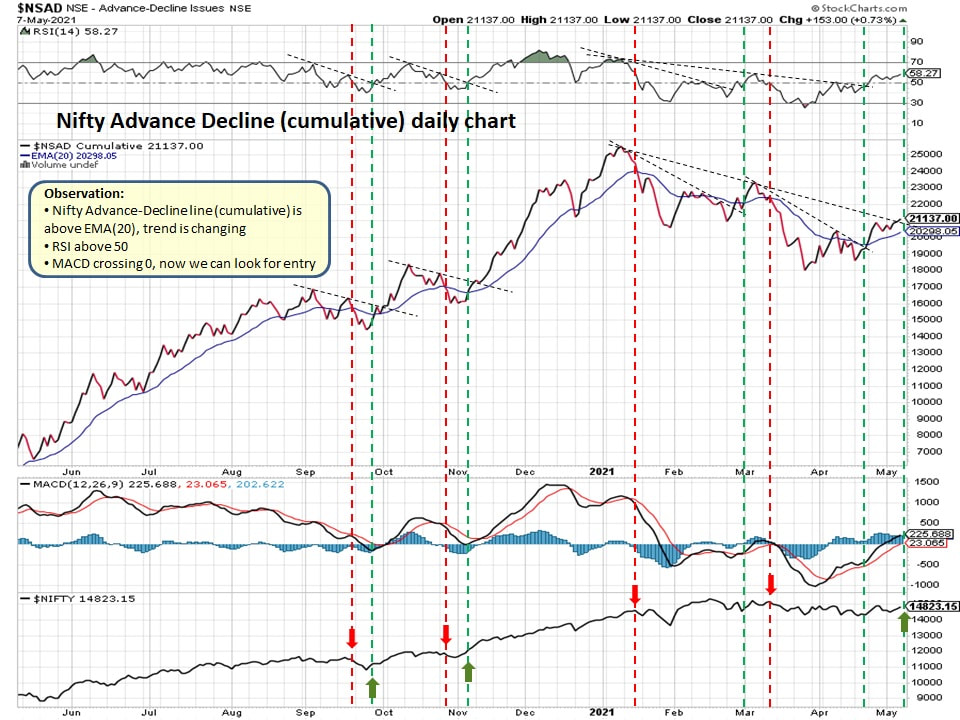
Nifty advance decline line is however providing subtle clues. The downtrend shown by dotted line is about to end soon if more stocks advance in coming days. Also MACD appears to be crossing above zero mark which is a good sign.
The best clue is provided by below chart. Can you figure out whats going on?
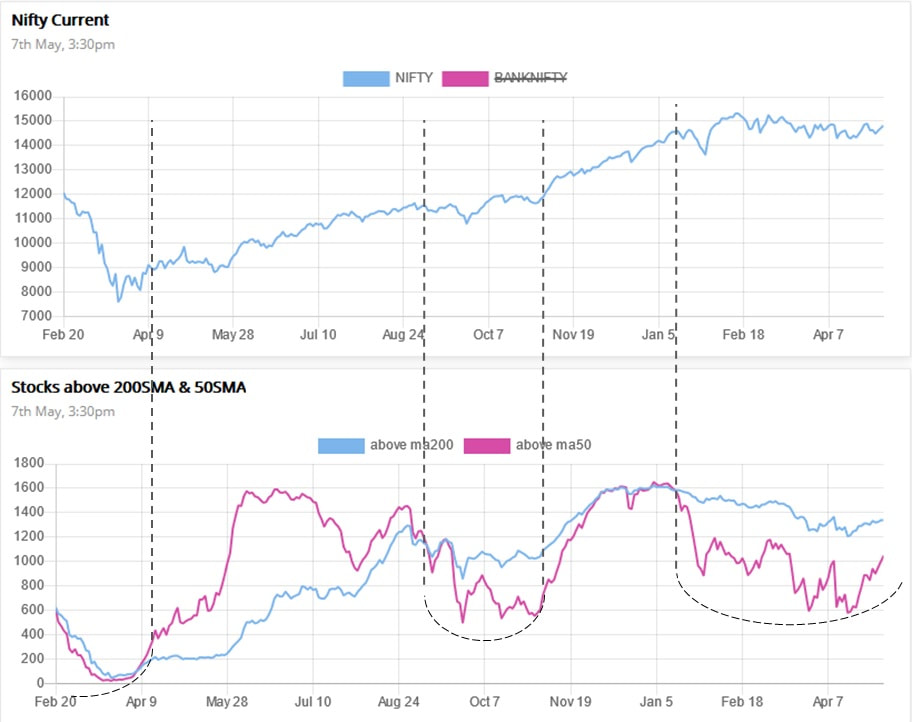
As more stocks are rising above their 50day SMA, the purple line is rising. Similarly, more stocks are rising above 200day SMA which is interpreted by blue line. If both lines keep rising then it means that Nifty will start rising as well as can be seen from previous scenarios. In other words, get ready for the Bull train to leave the station. We are not their yet but shall be their soon hopefully.
Good Luck!
Good Luck!

 RSS Feed
