Market has been climbing relentlessly for past three weeks without any meaningful pullback or sideways action. How long will this continue? When is the right time to enter!!! Are we out of the woods yet? Let's see if charts provide any clues...
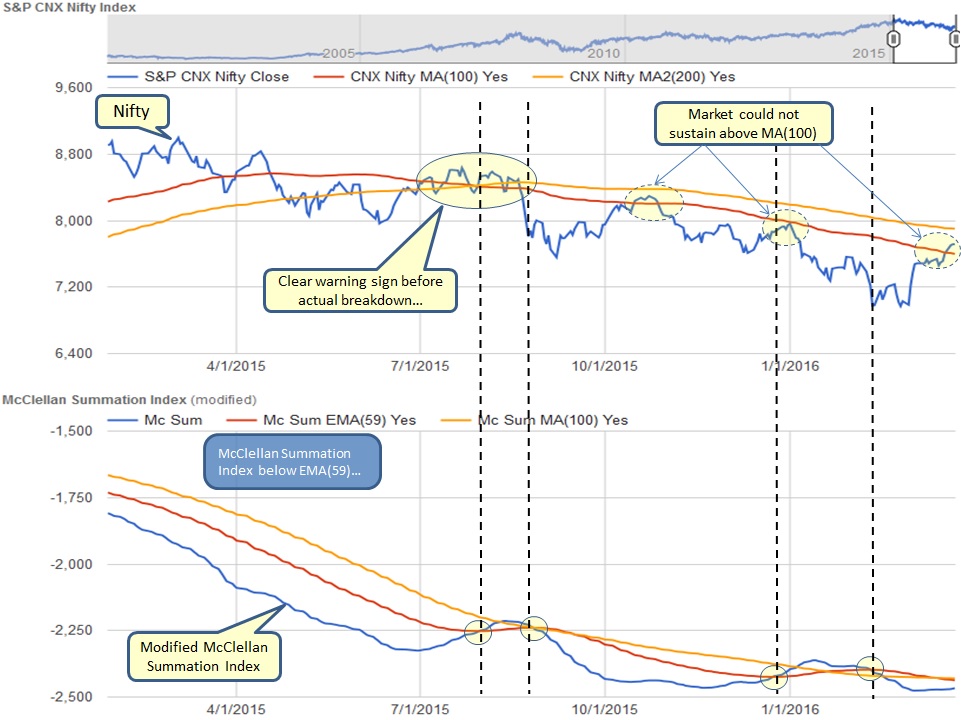
Market had cleared MA(100) but can it remain above it? Last two times, market could not hold for long above MA(100) hence it would be wise to remain cautiously optimistic. Both MA(100) and MA(200) are trending down while McClellan index appears to remain flat although below EMA(59) for now.
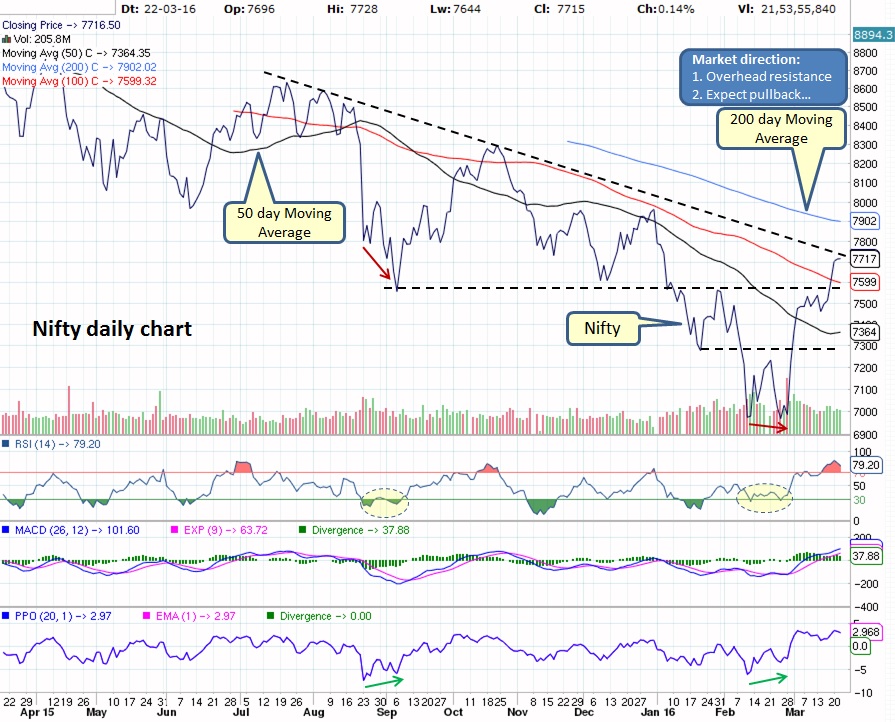
Daily Nifty chart shows market is hitting against trend line resistance (dotted line) while RSI is in overbought territory, in other words a pullback or sideways action can be expected.
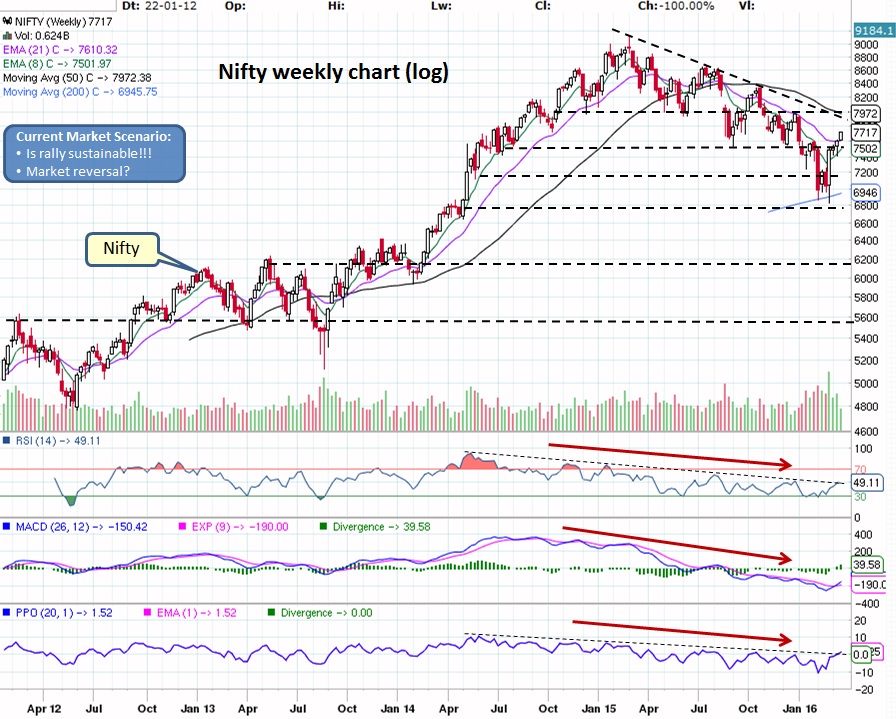
Weekly chart provides better clarity, as we can clearly see that market is in a resistance zone of 7600-8000. RSI is yet to decisively break the dotted trend line and move above 50 mark, however PPO has managed to break the trend line and move above zero mark.
Charts are telling us that most likely scenario at this juncture is sideways move or pullback. The magnitude of pullback will decide if bottom is in or further pain lies ahead! It is better to remain cautious until we get better low risk entry.
What does it mean for our Investments for now?
Try our Service -
Take a look at our service called "Quick Charts" which offers an easy visual way to look at daily and weekly charts of chosen stocks side-by-side. We hope it helps you in your research.
Market might be on verge of reversal but stay cautious...
What does it mean for our Investments for now?
- Mutual Funds - If still invested in equities then time to hold onto this roller coaster ride, exiting now will be very expensive and painful. No need to rush to start SIP unless we get positive trend reversal sign. If in cash/ FDs/ liquid funds then it is wise to stay on sidelines until we get confirmation.
- Stocks - ONLY invest in strong patterns with good earnings guidance and DO NOT forget to have STOP LIMIT on open positions. When market is in correction, it will drag everything down with it. Check out our trade size calculator to manage your risk along with potential buy candidates watch list.
Try our Service -
Take a look at our service called "Quick Charts" which offers an easy visual way to look at daily and weekly charts of chosen stocks side-by-side. We hope it helps you in your research.
Market might be on verge of reversal but stay cautious...

 RSS Feed
