After a good rally in September, market is currently in consolidation/pullback mode. The pullback appears to be contained thereby holding on to gains. Where will it go from here!!!
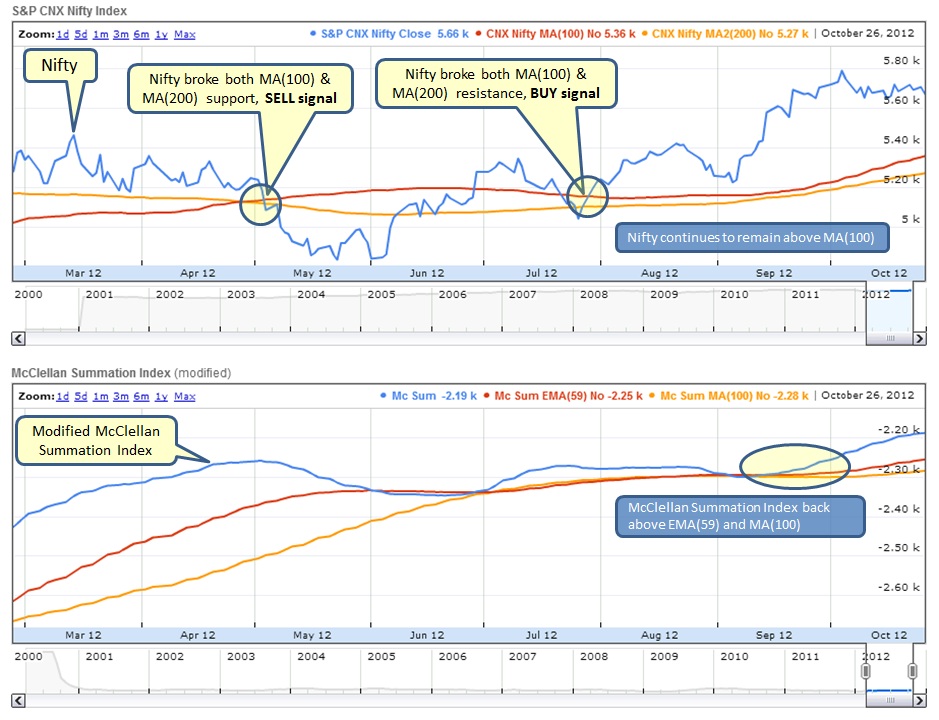
If you are following this blog for sometime then what can you derive from below chart?
- Is there any reason to be concerned? - Not at all
- If "NO" then WHY? - cause McClellan Index is well above EMA(59) while Nifty is well above MA(100) & MA(200)
- What is below chart used for? - Long term market direction
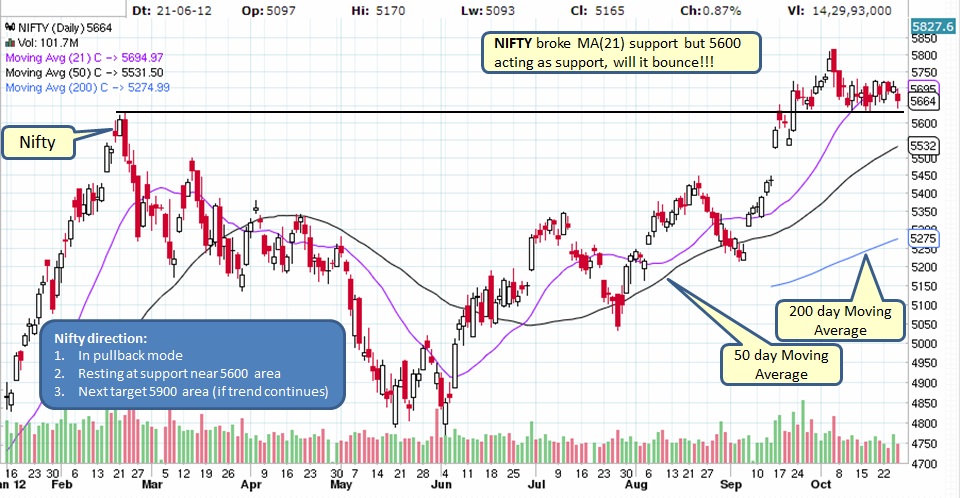
Market resting on the support near 5650 area, any slippage further will drop market to 5530 area where MA(50) will act as support, however we cannot rule out chances of bounce. But none-the-less market did break MA(21) support, in short term market can drift further lower hence be cautious. Any break above 5750 area will be bullish and could spark next leg up.
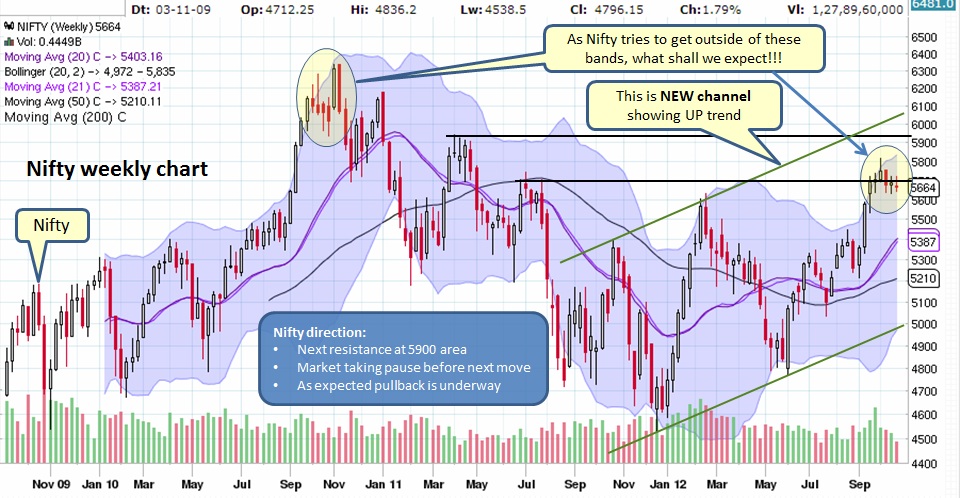
From below weekly Nifty chart, market is back inside the bollinger bands and has more room to run higher. The bullish trend is intact, however we might see further pullback.
What does it mean for Long Term Investments?
Be alert and stay cautious...
- Mutual Funds - Stay invested and once market breakout to UP side you may want to some of your positions
- Stocks - Invest in right patterns along with STOP LIMIT in place, however stay cautious
Be alert and stay cautious...

 RSS Feed
