Market has managed to remain range bound so far with no clear direction. What shall we expect for next month! Are charts providing any clues? Let's check 'em out....
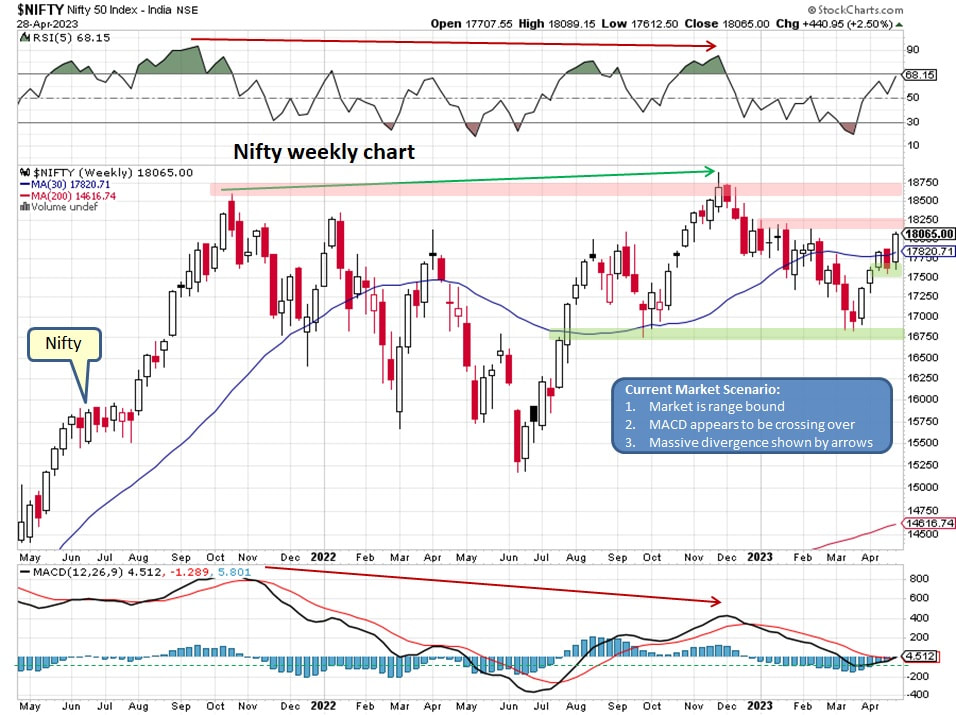
Nifty weekly chart below is providing few clues:
- Nifty has strong resistance to overcome, displayed by red shaded area
- RSI is approaching overbought levels
- MACD appears to be crossing signal line which can be considered bullish
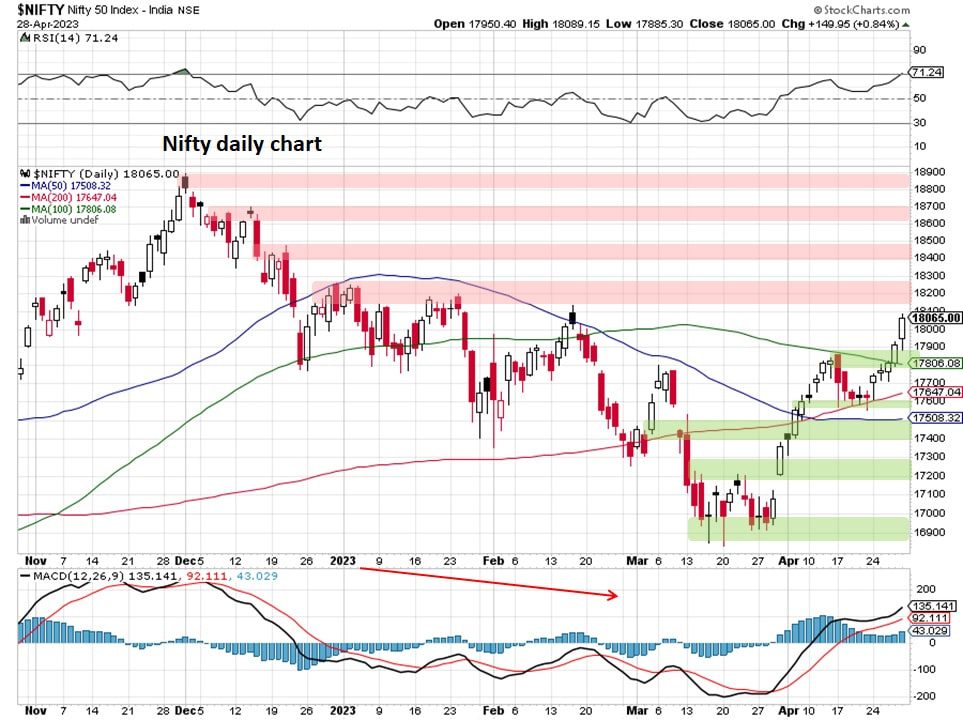
Daily Nifty chart is displaying immense resistance if this market embarks upon a bull rally. But can such a bull rally materialize? Answer to this question is provided by next 2 charts.
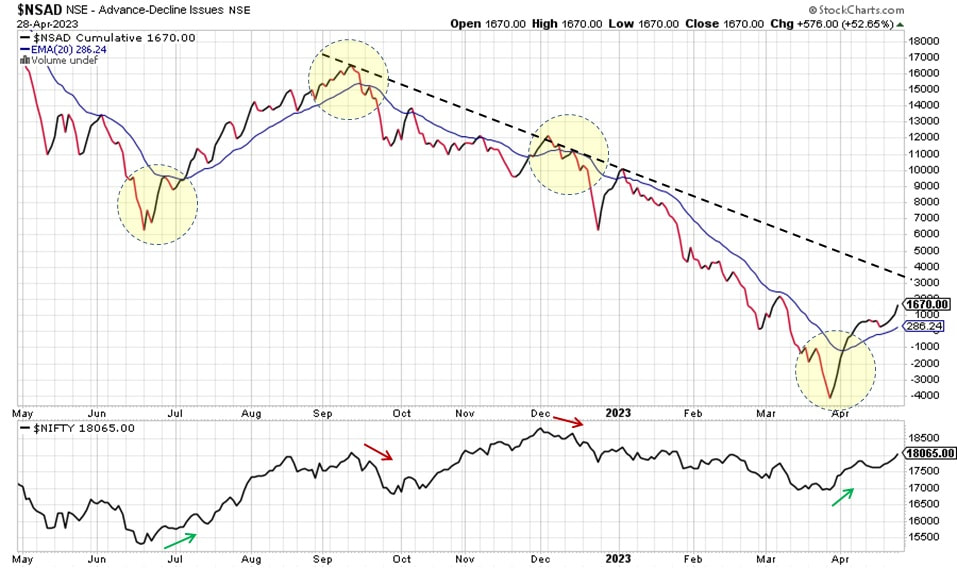
Nifty advance decline chart below is showing more stocks are advancing than declining. For any strong sustainable bull rally we would like to see this line trending upwards. However, there are instances when market continues to go up while AD line continues to remain in downtrend which suggests that very few stocks are participating in the rally.
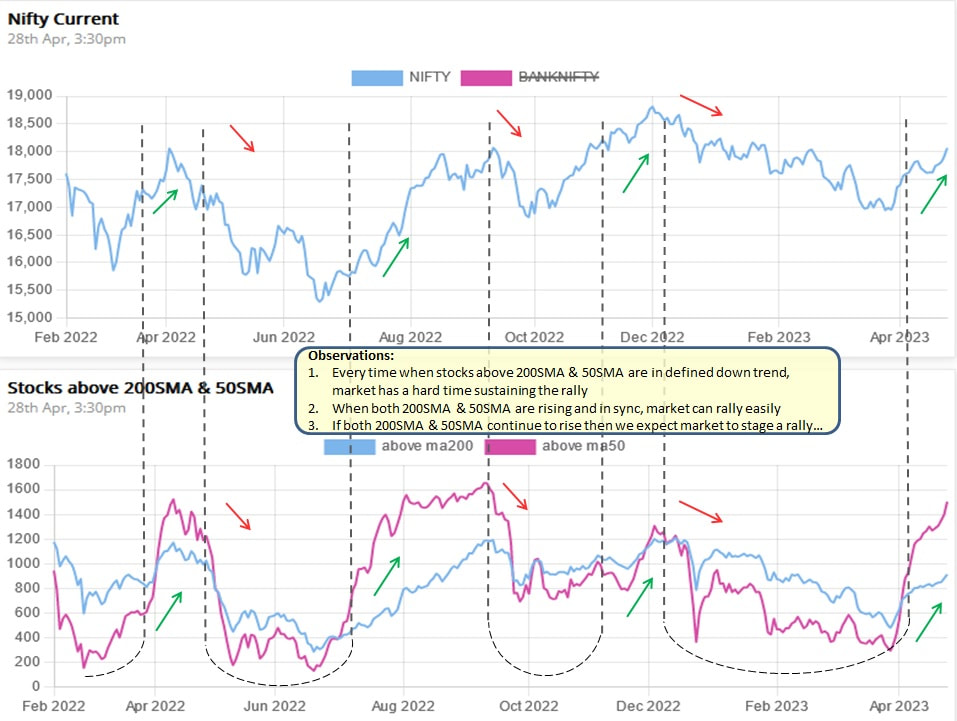
Below chart is displaying that more stocks are above their respective 50day and 200day moving averages and as a consequence of that market is marching higher from recent lows.
Summary:
Market remains range bound hence wise to be cautious...
- Market remains range bound for now and requires to overcome resistance
- More stocks are participating in the rally which shall help the overall market
- However if number of stocks participating in the rally drops then market may break support areas
Market remains range bound hence wise to be cautious...

 RSS Feed
