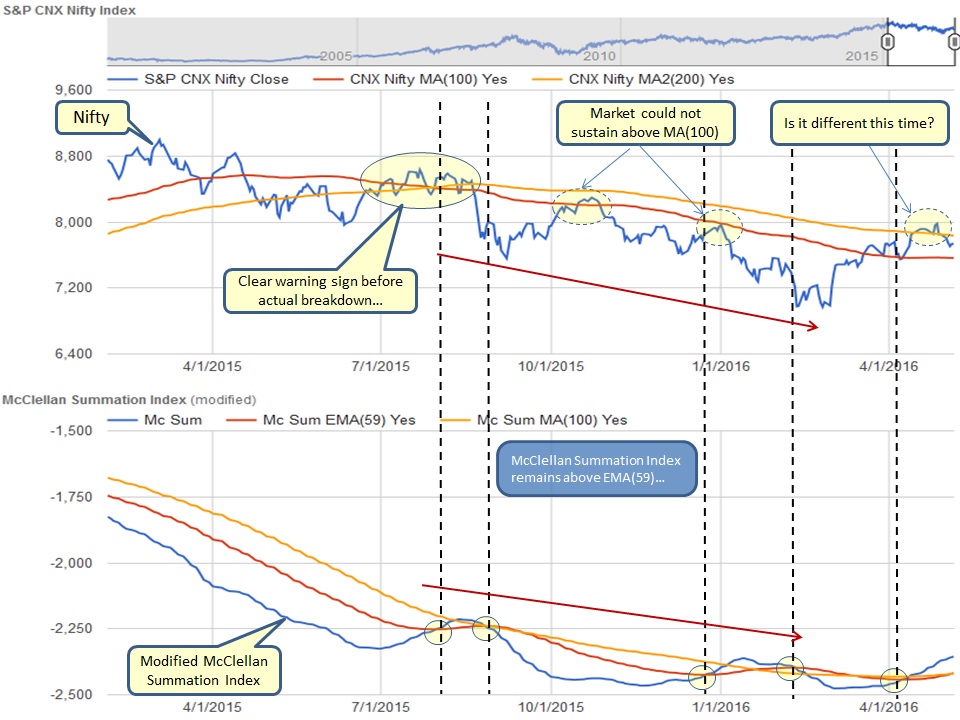
Market barely breached MA(200) and appears to be in pullback mode, BUT the magnitude of this pullback is crucial. Will we witness a pattern similar to beginning of 2012!!! What shall we be aware about going forward...
Market could not sustain above MA(200) which was expected, however how deep the pullback will be remains to be seen. BUT observe McClellan Index, we suspect that as the pullback unfolds, this index will continue to rise and may come near EMA(59) or even marginally touch/drop below it only to rise back again. This in turn will tell us that more stocks are advancing than declining in cumulative fashion even though the market appears to be in pullback mode.
How can more stocks advance when market is dropping?
Nifty Index components has far fewer stocks than entire NSE and hence it is absolutely possible. More stocks can manage to advance even though Nifty is dropping due to the fact that stocks in Nifty Index are declining but overall stocks in NSE are advancing. McClellan index is taking into account all the NSE stocks and not just Nifty Index components.
We hope this clarifies any confusion.
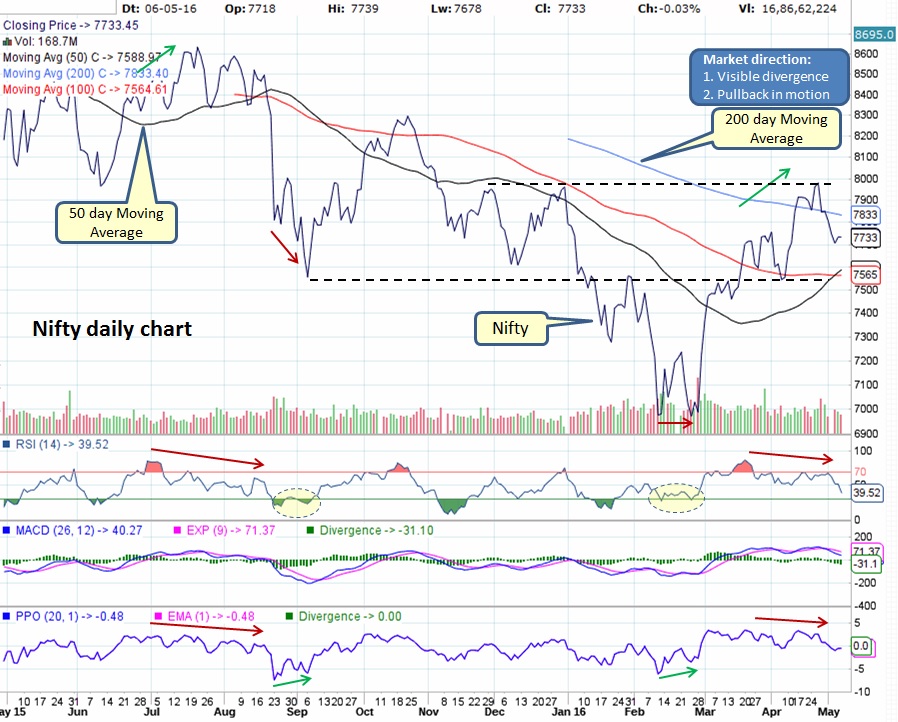
Daily Nifty chart below provides very clear clues before even this pullback begins:
But below chart also suggest a possible support near 7550 area near MA(100), also watch RSI is very close to being oversold level which might provide enough conditions for a market bounce.
- Market heading into resistance near 8000
- As market makes higher highs, RSI and PPO are making lower lows also known as divergence
- MACD also rolled over
But below chart also suggest a possible support near 7550 area near MA(100), also watch RSI is very close to being oversold level which might provide enough conditions for a market bounce.
Weekly chart shows that strong market resistance near 8000 area and a decline between 7200-7500 area cannot be ruled out as market always does things to spook majority investors.

We expect market to stall its decline around 7550 areas, might bounce or become range bound for a while before continuing the pullback further. However, if market manages to break above 8000 area then that might spark the next BULL run for months to come. Only time will tell, hence remain cautious and alert.
What does it mean for our Investments for now?
Try our Service -
Take a look at our service called "Quick Charts" which offers an easy visual way to look at daily and weekly charts of chosen stocks side-by-side. We hope it helps you in your research.
Market pullback underway, be cautious and alert...
What does it mean for our Investments for now?
- Mutual Funds - If still invested in equities then time to sit tight, as we are on the cusp of turn around. No need to rush to start SIP unless we get positive trend reversal sign. If in cash/ FDs/ liquid funds then it is wise to stay on sidelines until we get confirmation. Be patient for low risk entry during the market pullback.
- Stocks - ONLY invest in strong patterns with good earnings guidance and DO NOT forget to have STOP LIMIT on open positions. When market is in correction, it will drag everything down with it. Check out our trade size calculator to manage your risk along with potential buy candidates watch list.
Try our Service -
Take a look at our service called "Quick Charts" which offers an easy visual way to look at daily and weekly charts of chosen stocks side-by-side. We hope it helps you in your research.
Market pullback underway, be cautious and alert...

 RSS Feed
