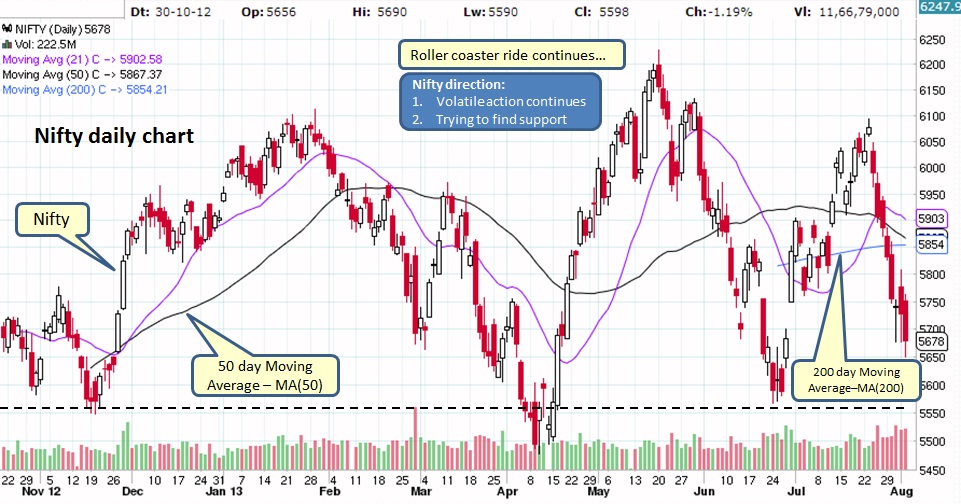
So far, roller coaster ride continues and market remains in the wide range (5500-6100). Will it be any different this time? Market is desperately trying to find support which it may be able to find near 5500 area. Is this sign of Trend change!!!
What is below chart telling us?
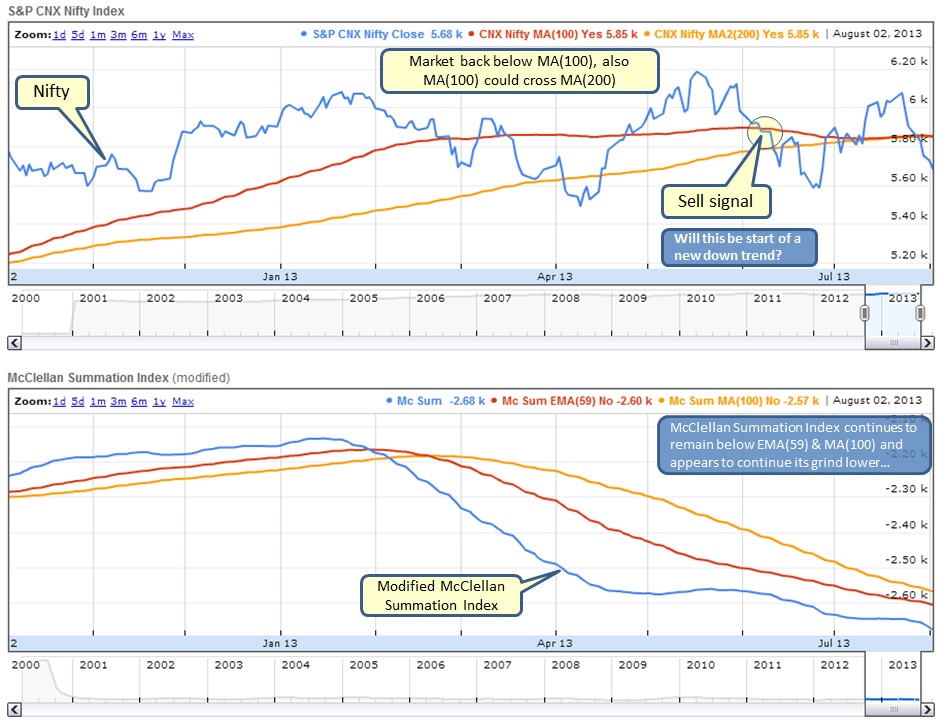
- McClellan Index in bottom section of the chart continues its descent as well as remains below EMA(59) & MA(100) suggesting more stocks are declining and less stocks are advancing
- Nifty has dropped below MA(100) & MA(200), this might turn into change of direction. Also MA(100) appears to have aligned with MA(200) and might crossover anytime now which would be bearish
Volatile action is clearly visible in daily Nifty chart below. market may be able to find support near 5500 area but will the support hold this time!!!
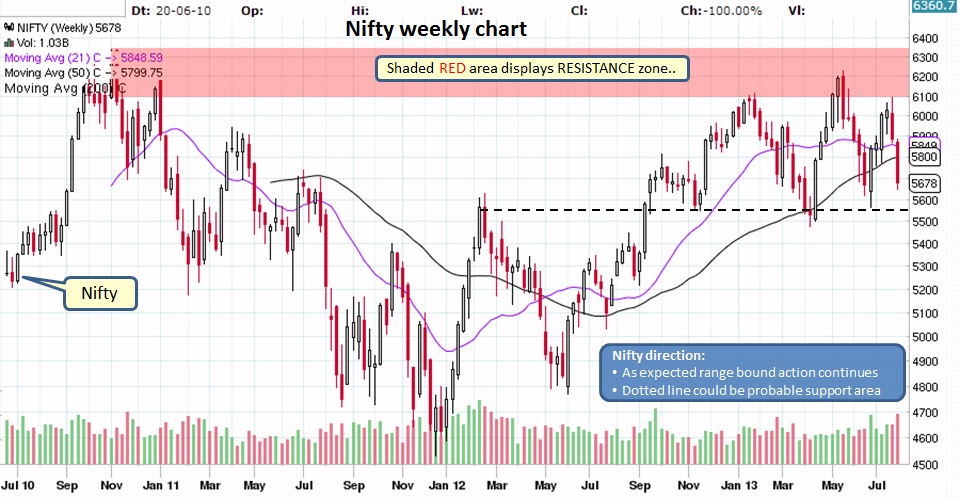
On weekly Nifty chart below, it appears as if market has put in a TOP for this year and unable to break through the resistance shown by shaded area. We can see 3 TOP formations also known as "Triple Top" pattern suggesting possible rollover and change of trend especially if market drops below 5500 area.
What does it mean for our Investments?
Market appears to be changing direction, be cautious...
- Mutual Funds - By now you should have closed any position in equity funds as markets are showing signs of rollover. Hopefully, you would have identified debt/bond funds to remain invested once the market changes its direction.
- Stocks - Take partial gains on open positions and have strict STOP LIMIT or trailing STOP on remaining position. Entering new positions might be risky unless the pattern is very convincing, however do not forget to have STOP LIMIT in place. In volatile times, its better to remain in cash.
Market appears to be changing direction, be cautious...

 RSS Feed
