Market finally broke out to all time high after being range bound for almost 1.75 years. But will this rally continue or will this become bull trap? How can we check health of this market?
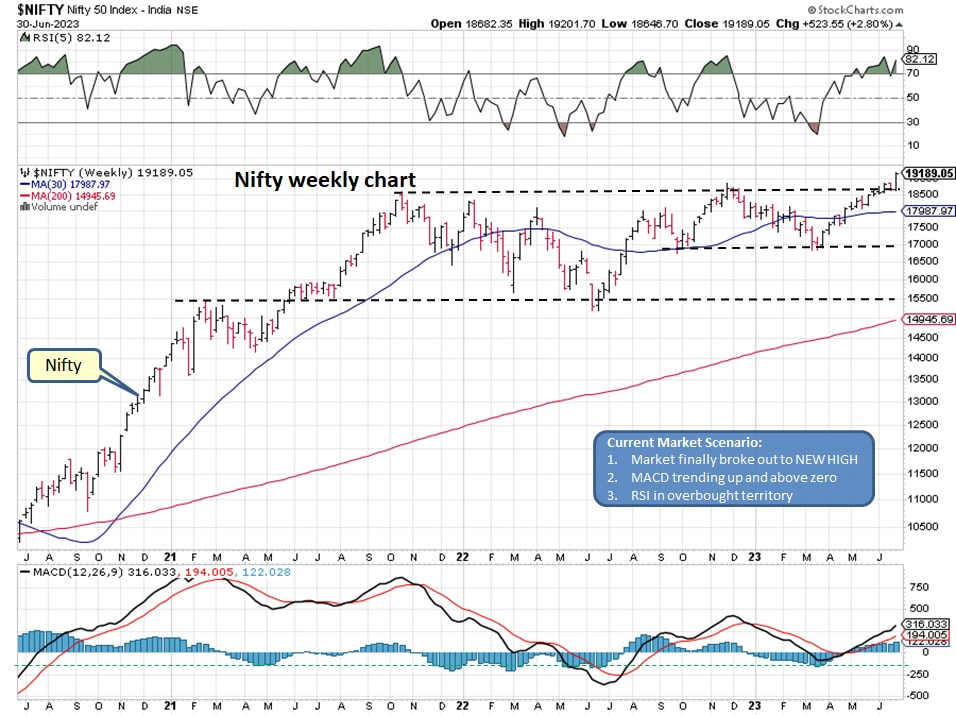
Nifty weekly is displaying breakout to new high area:
- RSI appears to be embedded into overbought territory suggesting it can remain in that level for some time
- MACD is above zero and rising also suggesting bullish momentum
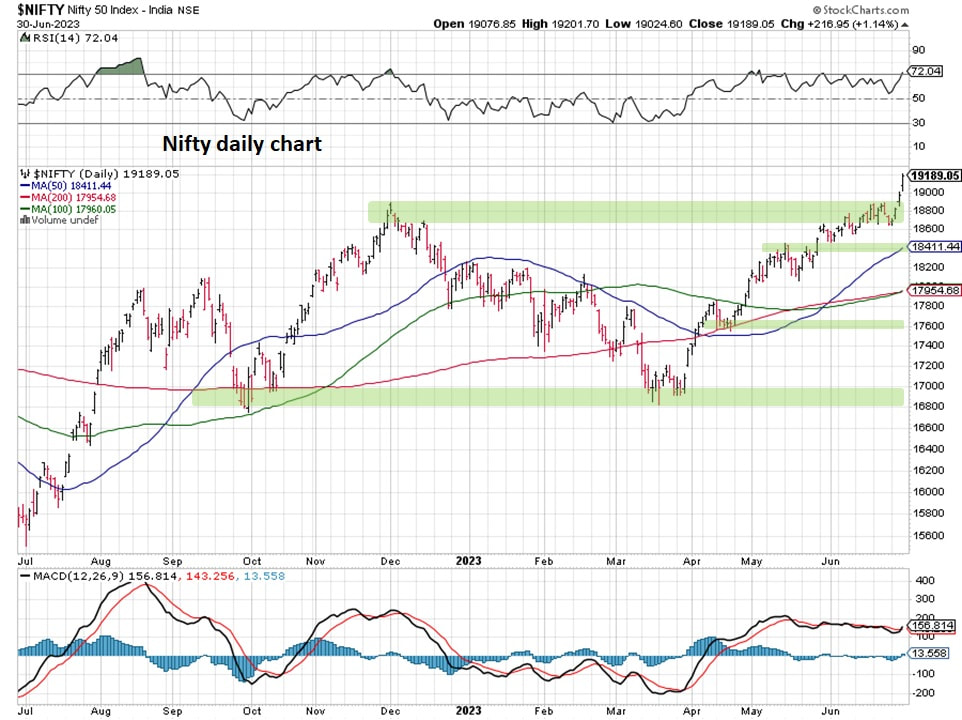
Daily Nifty chart also displaying breakout to new all time high area:
- RSI well above 50 mark and appears to be in overbought territory
- MACD is flat but appears to be turning up and well above zero level
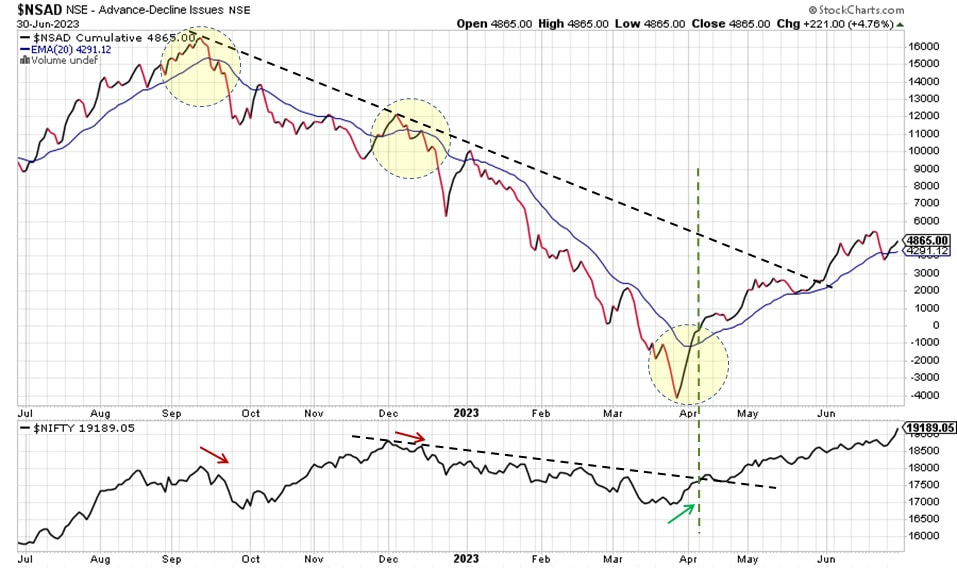
Nifty advance decline line is rising for several months now suggesting more stocks are advancing than declining which is also reflected in the market rally.
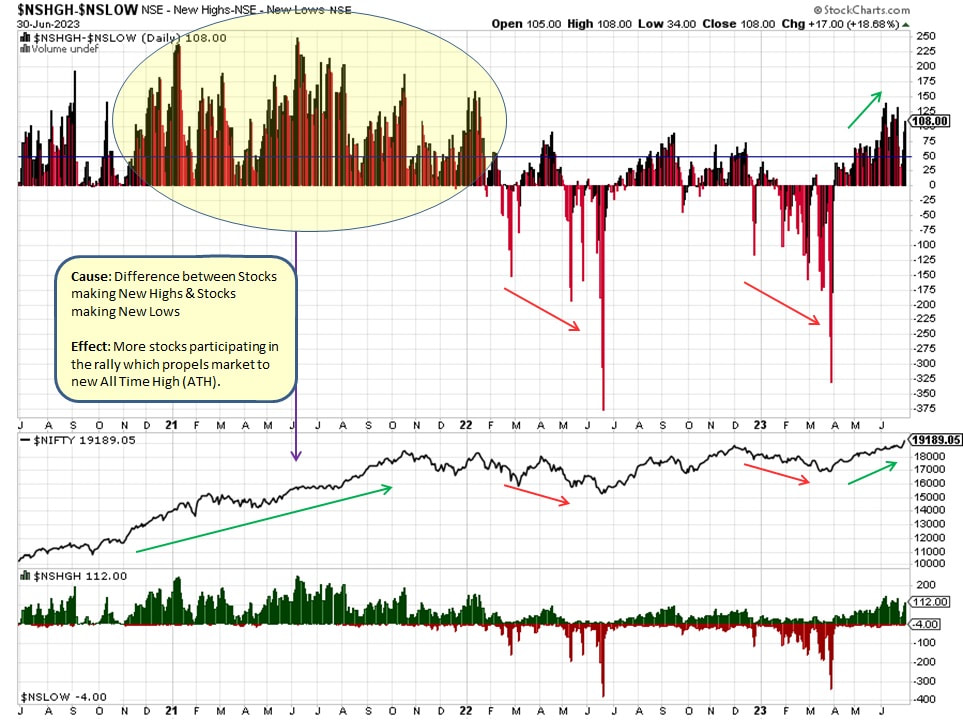
Difference between Net New Highs & Net New Lows is displaying a very clear picture. Observe the correlation between NSHGH-NSLOW (upper chart panel) to Nifty (middle chart panel).
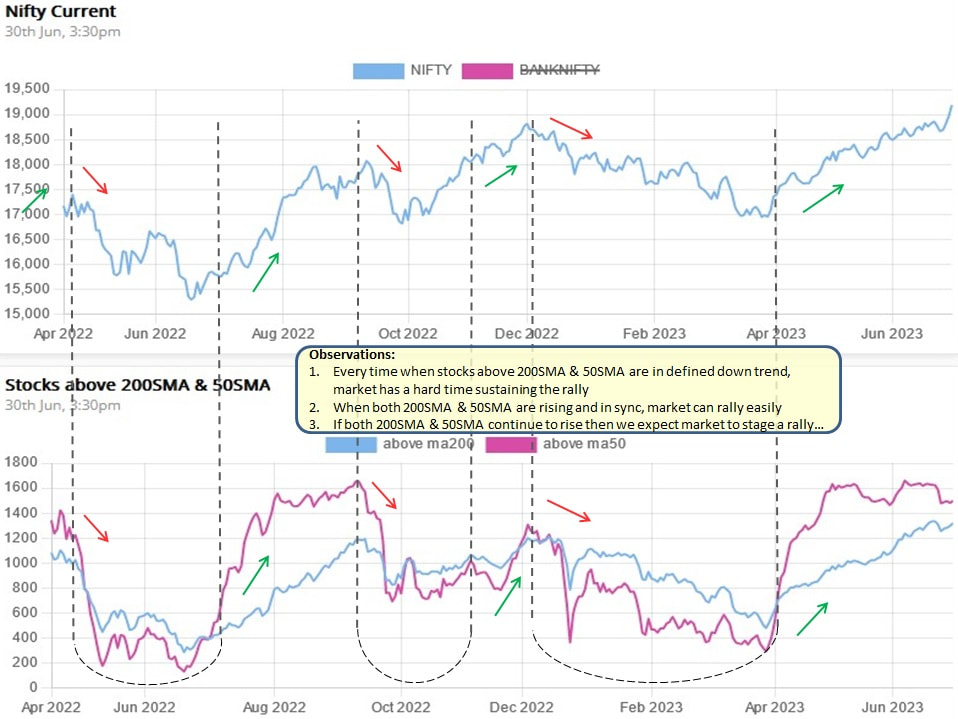
Below chart was displaying more months that more stocks are above their respective 50day and 200day moving averages, suggesting healthy market internals which is also reflected in the current market rally.
Summary:
Market internals are supporting current market rally suggesting a healthy market. In other words, higher probability of this rally being sustainable and a push higher. Expect pullback along the way.
Market in bullish mode...
Market internals are supporting current market rally suggesting a healthy market. In other words, higher probability of this rally being sustainable and a push higher. Expect pullback along the way.
Market in bullish mode...

 RSS Feed
