As mentioned last time, market continues to remain under pressure. So when shall we expect change of behavior? Let's take a look charts to find any clues...
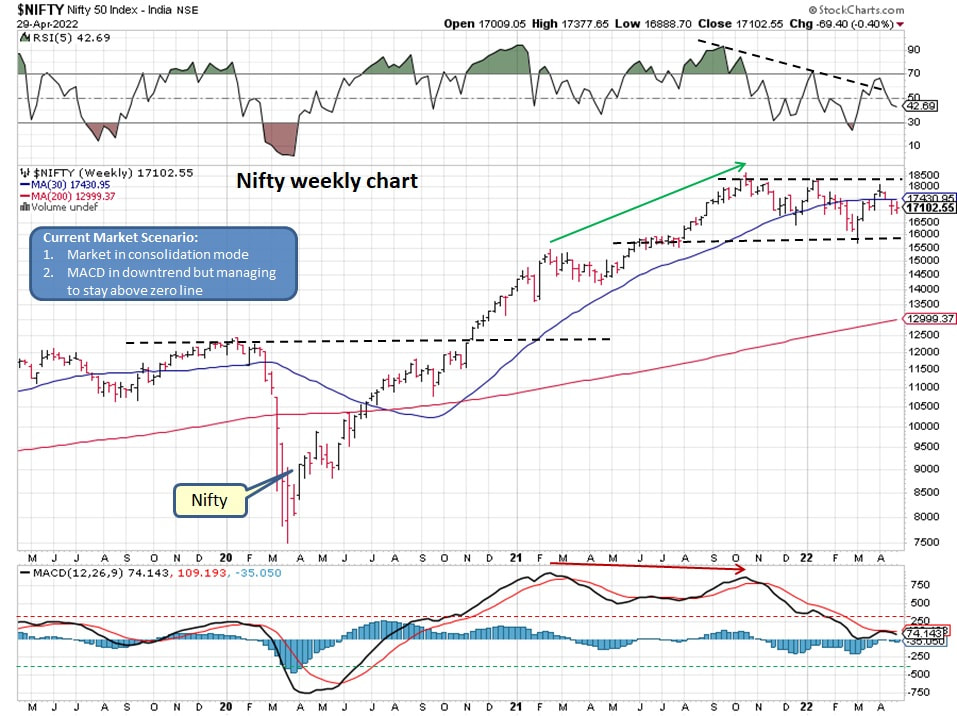
Nifty weekly chart clearly displays that market is range bound:
- RSI is below 50 mark
- MACD is barely hanging above zero mark, however it is in downtrend
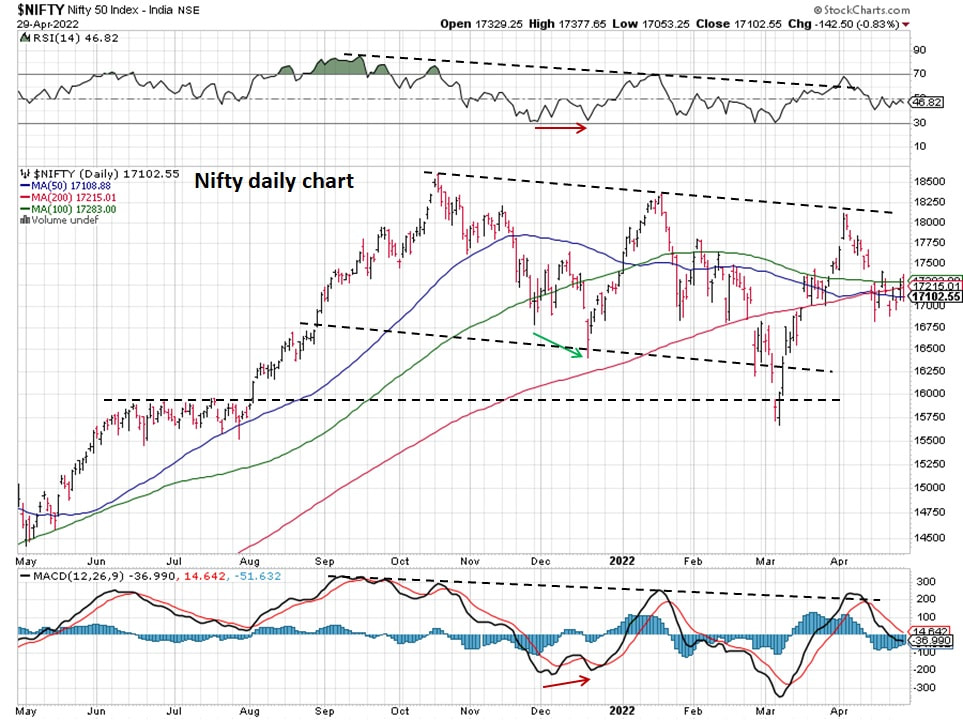
Daily Nifty chart shows that rally at the end of March was paused right at the dotted trend line and now market is at a critical juncture, sitting right on both 50day and 200day moving averages. Unless the upper dotted trend line is broken, this market has higher probability to stay in the range and drop below key moving averages.
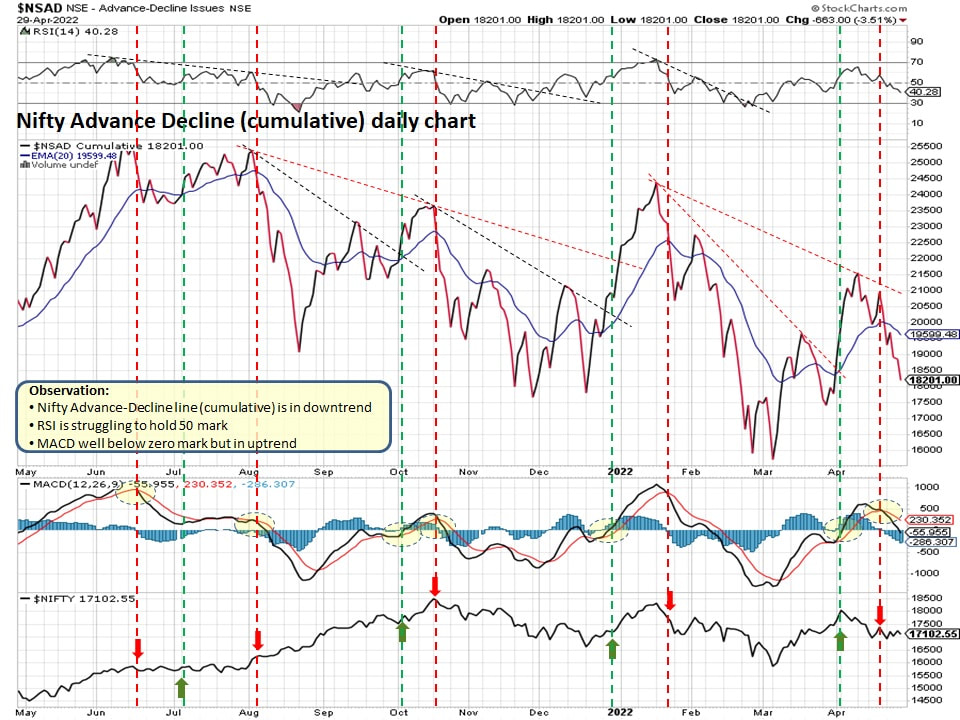
Nifty AD line is not encouraging as it continues to remain in downtrend.
Number of stocks above 50SMA and 200SMA is in downward trend, which makes sense as Nifty is also not able to stage a rally.
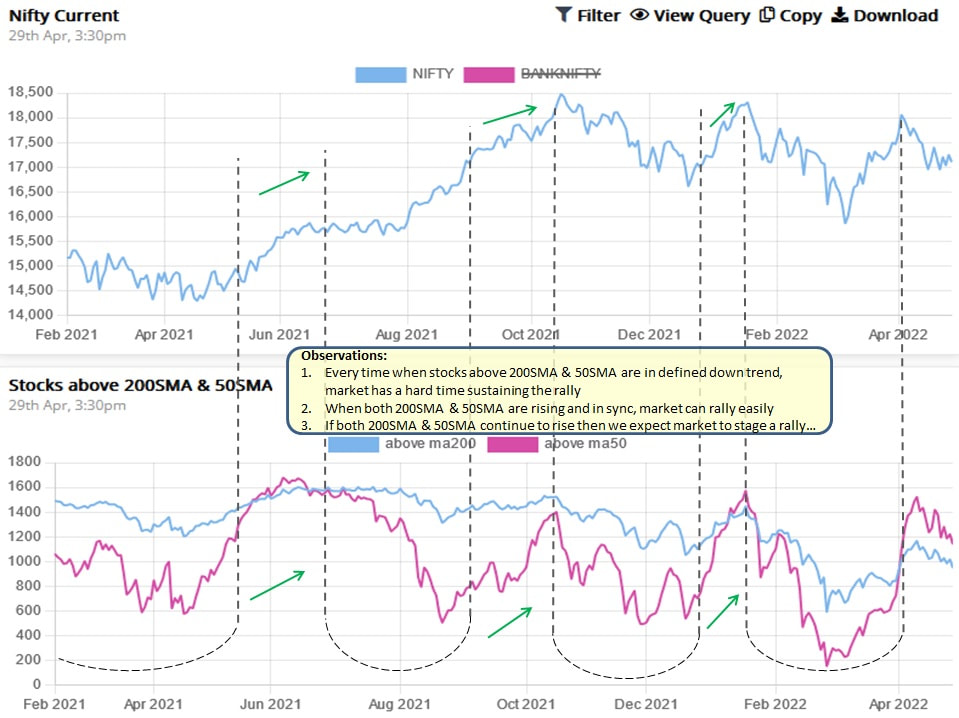
Charts observations are clearly suggesting that unless we get:
Better to be cautious as market remains range bound...
- more participation from stocks which will result in stocks moving above their respective 50Day MA and 200day MA
- more stocks advancing than declining resulting in AD line moving higher
- Number 1 & 2 will cause Nifty to breakout of its range bound behavior
Better to be cautious as market remains range bound...

 RSS Feed
