As suggested earlier, market could not overcome resistance near 8300 area and now back into range. What could be the most likely outcome from this point forward? Lets take a look at charts...
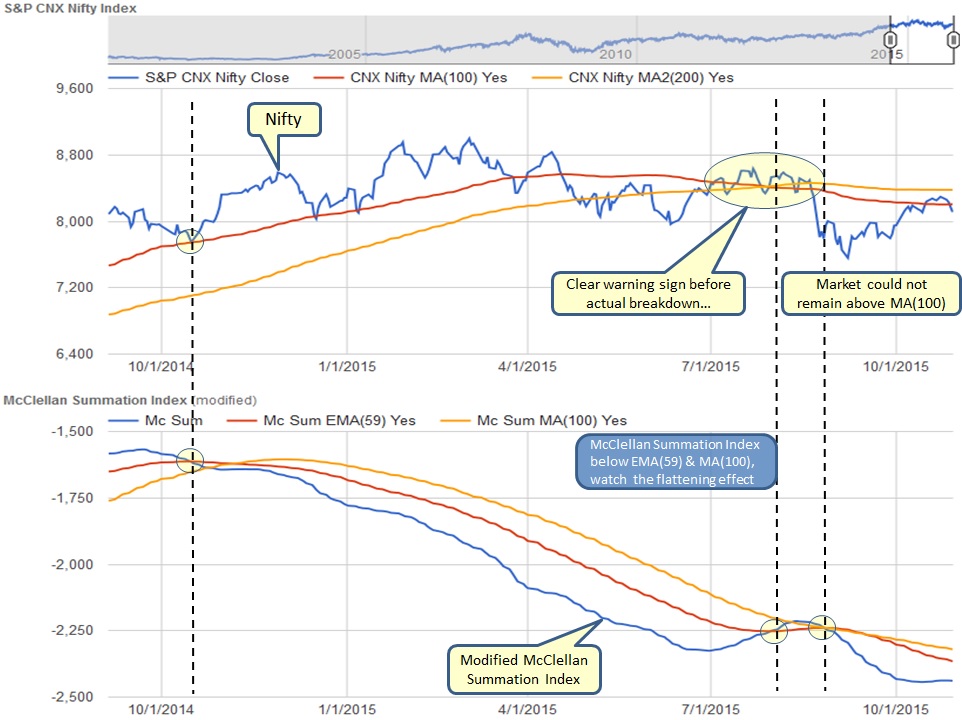
Below chart is providing key information:
- Nifty back below MA(100) while MA(100) remains below MA(200) - Both suggesting to remain cautious as further downside is possible
- McClellan Index well below EMA(59), however it is flat for now - By remaining flat, it is suggesting that equal number of stocks are advancing compared to declining on cumulative basis
Take a look at below charts, first chart was posted here at the beginning of October, followed by middle of October and current chart. The first chart was speculation and 2nd chart shows execution. What does this mean? Listening to charts we can get many clues ahead of time and can anticipate the next market move.
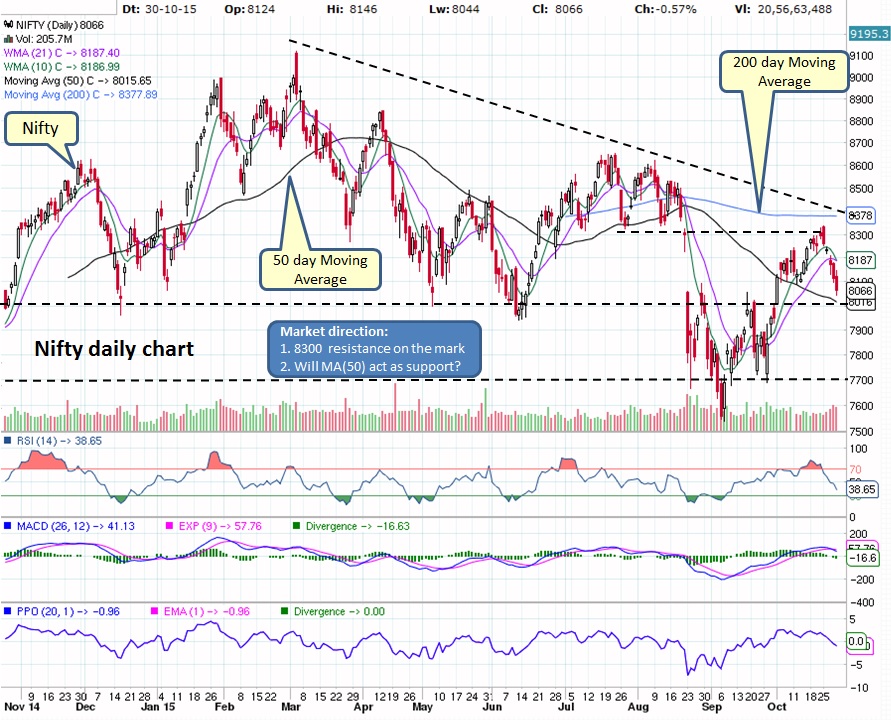
A clear resistance at 8300 area is visible in daily Nifty chart below. As market is back in the range, will MA(50) act as the support remains to be seen. It should not be a surprise if market drops below MA(50) and is stuck in 7700-8000 area OR market may get a bounce at MA(50). The bigger question is can this market turn around and get above MA(200)!!!
Weekly chart is giving us subtle clues, check RSI which continues to remain below 50 mark while PPO has dropped below zero mark. Both suggesting further downside.
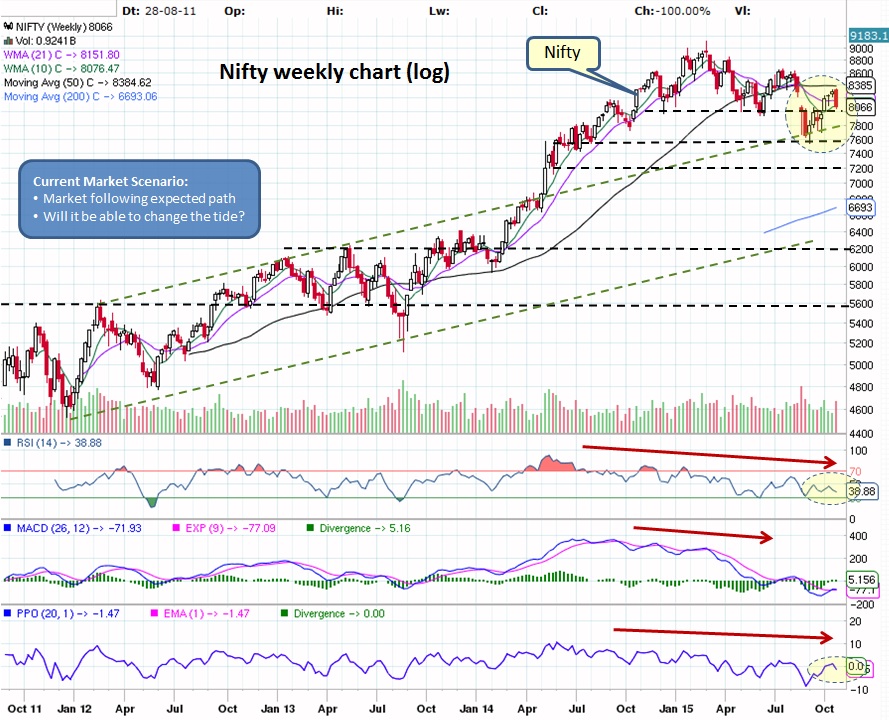
Bounce was not sustainable and market could not overcome the resistance at 8300 area. Until market is back above MA(200), this trend cannot be reversed and downside risk is higher.
What does it mean for our Investments?
Market remains vulnerable hence be cautious...
What does it mean for our Investments?
- Mutual Funds - If still invested in equities then watch if market can sustain this rally. No need to rush to start SIP unless we get positive trend reversal signs. If in cash/ FDs/ liquid funds then it is wise to stay on sidelines.
- Stocks - ONLY invest in strong patterns with good earnings guidance and DO NOT forget to have STOP LIMIT on open positions. When market is in correction, it will drag everything down with it. Check out our trade size calculator to manage your risk along with potential buy candidates watch list.
Market remains vulnerable hence be cautious...

 RSS Feed
