After a nice rally in last 2 months, market ran into overhead resistance. Does it have enough fuel to keep marching higher or Is this rally done and market is headed lower? Let's check if charts are providing any clues...
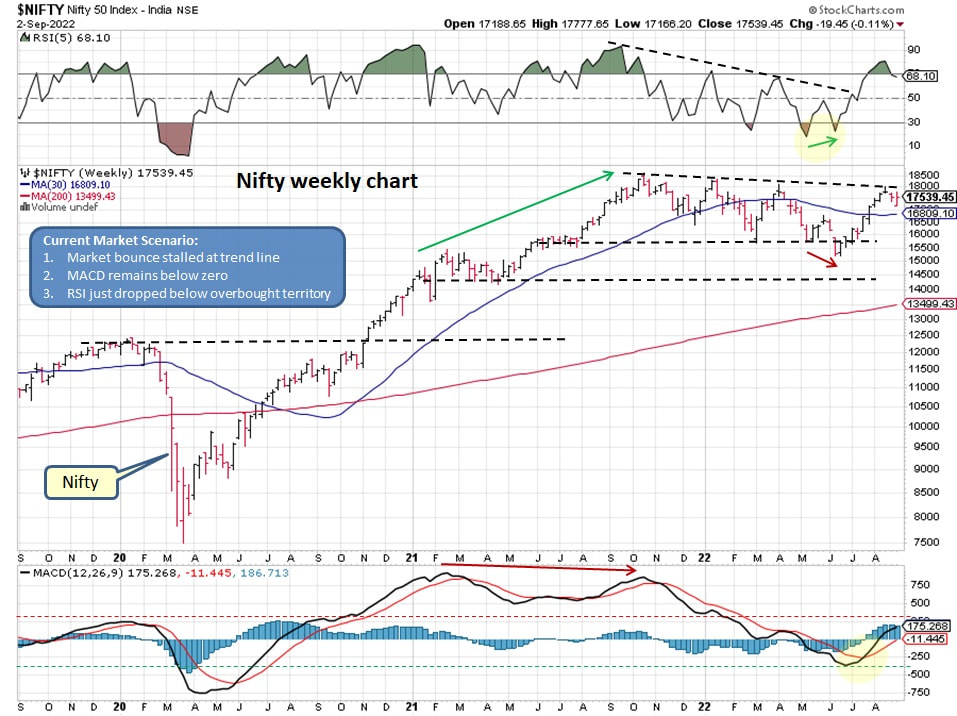
Trend line resistance is very clear in below weekly Nifty chart. Market appears to be consolidating near the highs which is a good sign as if conserving energy before a breakout. MACD just crossed above zero while RSI is just dropping below overbought level.
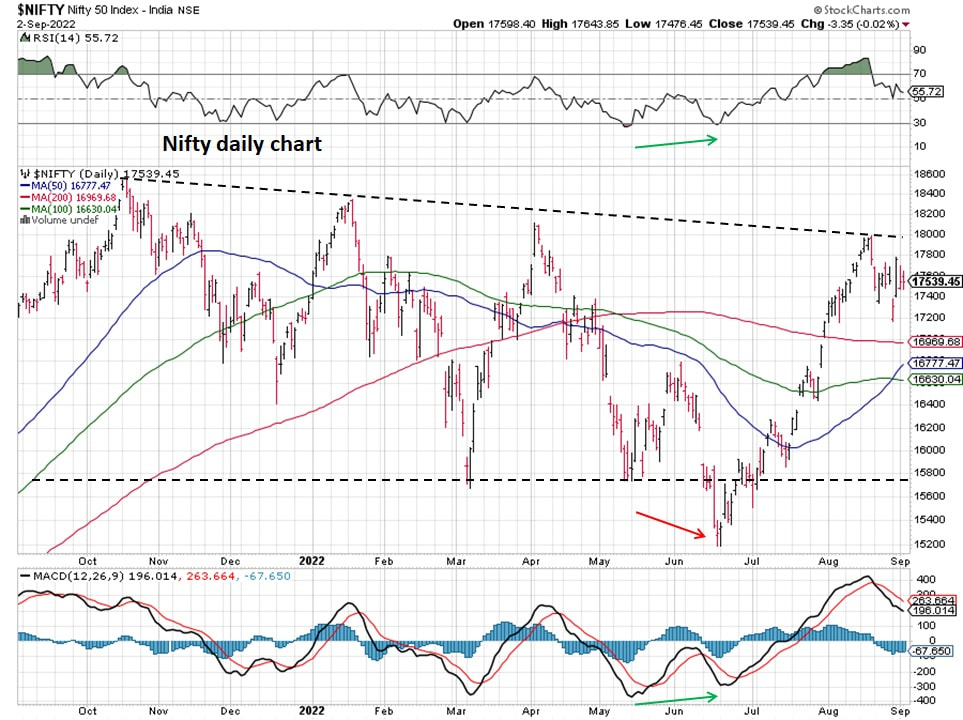
Consolidation is clearer in daily Nifty chart below. The longer we remain in consolidation near trend line resistance, the better chance of sustained breakout.
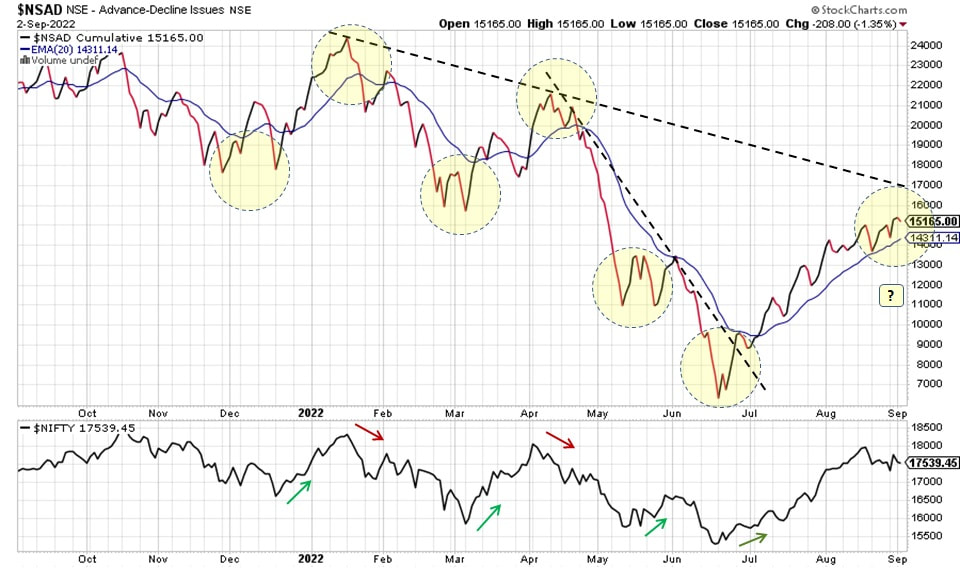
Nifty advance decline line appears to be stalling, as long as it does not change direction market has a shot at sustained breakout.
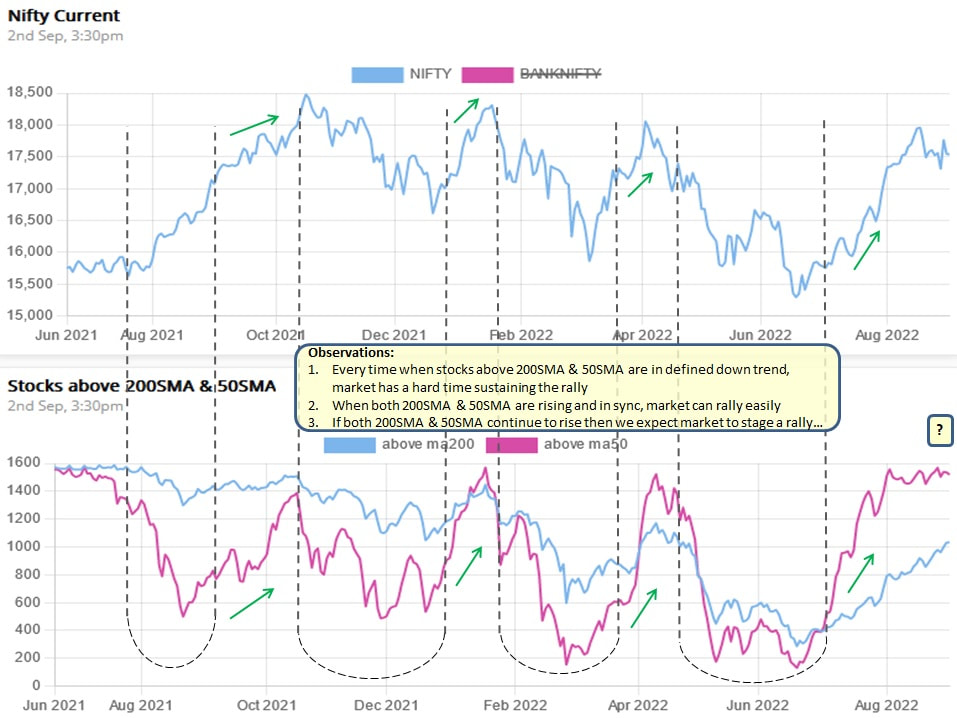
More stocks are participating in the rally and above their respective 50day and 200day moving averages, suggesting good health of the overall market.
Summary:
Market remains range bound, be cautious...
- Market is undergoing consolidation as if taking a breather after a nice rally and conserving energy for the next part of the rally, time shall reveal
- Daily & Weekly chart are also showing consolidation but not providing any other clues
- Nifty advance decline line might run into trend line resistance, however if it changes direction then this rally will come under pressure
- More stocks are participating in the rally we have sen so far, a change in behavior will cause for concern going forward
Market remains range bound, be cautious...

 RSS Feed
