Market is barely staying above MA(50) and MA(200) in a very choppy action. At the beginning of July, it did appear as if a change in trend was occurring, however its more than a month and market struggle continues. Where is this leading to?
What is below chart telling us?
- Nifty barely hanging above MA(100) and MA(200) while MA(100) is below MA(200) - suggesting caution as MA(100) is below MA(200) which is NOT a good sign and often leads to corrective move.
- McClellan Index is above EMA(59) - suggesting more stocks are advancing compared to declining in cumulative manner which is a good sign especially if this market decides to turn around to upside.

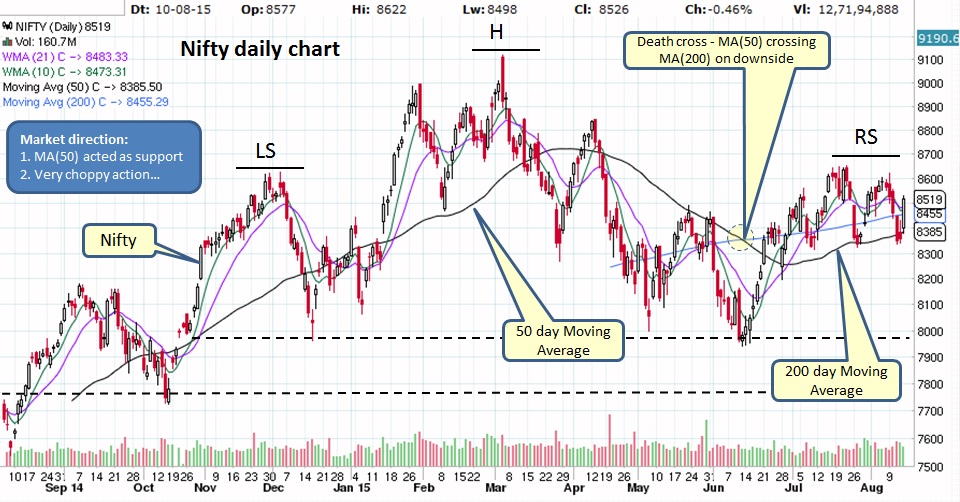
Not much has changed in below Daily Nifty chart. The moment MA(50) support is broken, Head-Shoulder pattern will be completed, however as long as market stays in a tight range between 8300-8700 benefit of doubt goes to BULLs.
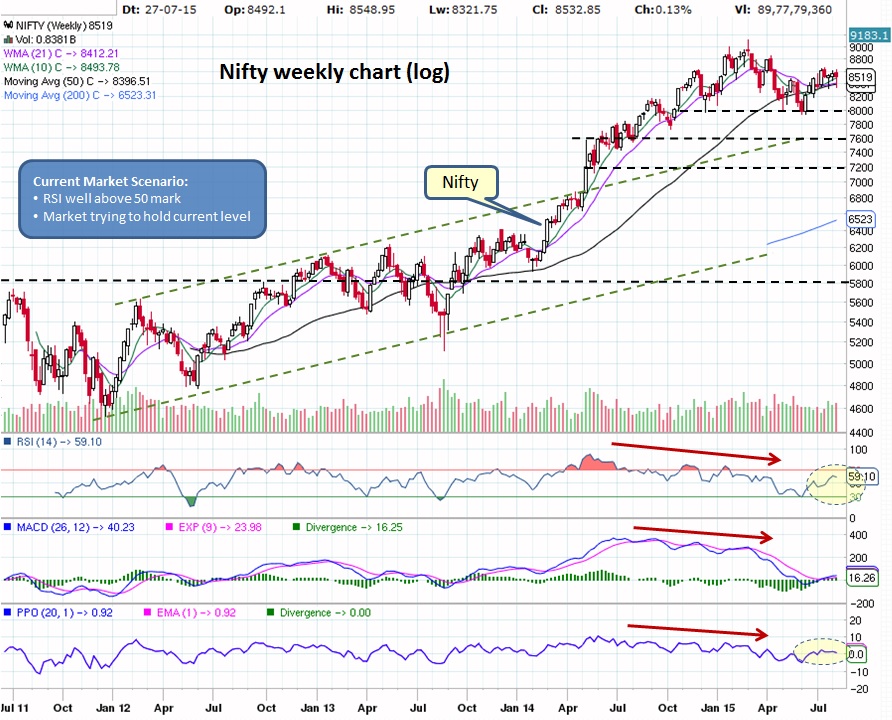
Weekly Nifty chart tells us that market is trying to hold current level by moving sideways, but for how long? RSI continues to remain above 50 mark while PPO is barely above zero mark.
Charts are telling us to remain cautious and yet benefit of doubt goes to BULLs. As long as market remains above MA(50) line BULLs have upper hand. Market has to break above 8650 level to invalidate the head-Shoulder pattern.
What does it mean for our Investments?
Market trying to turn around yet telling us to be cautious...
What does it mean for our Investments?
- Mutual Funds - If still invested in equities then stay invested as market might be turning around. If in cash/ FDs/ liquid funds then the low risk entry was near MA(50), however the risk is elevated and one needs to be ready to pull the plug.
- Stocks - ONLY invest in strong patterns with good earnings guidance and DO NOT forget to have STOP LIMIT on open positions. When market is in correction, it will drag everything down with it. Check out our trade size calculator to manage your risk along with potential buy candidates watch list.
Market trying to turn around yet telling us to be cautious...

 RSS Feed
