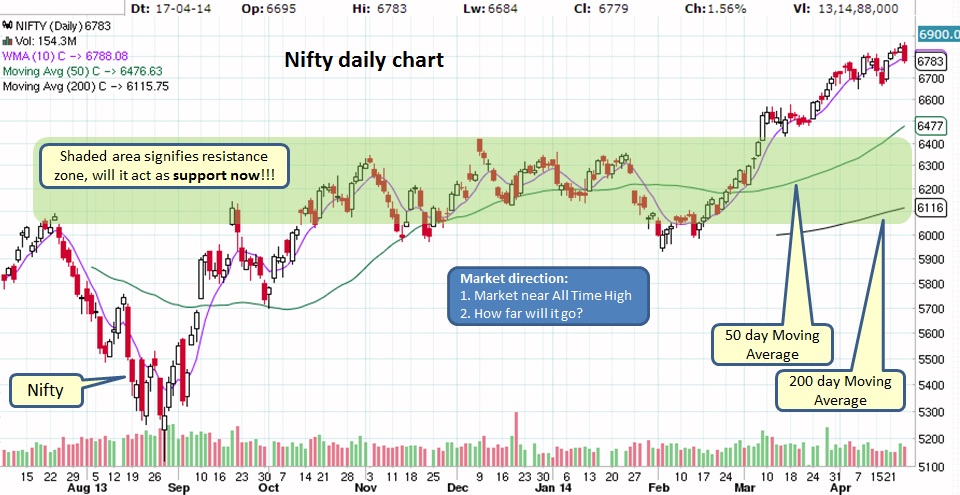
Market has managed to rally relentlessly and it seems like no news/event can stand in the way. National election results are three weeks away and we are probably witnessing euphoria and anticipation rally in the markets. BUT how far will this continue? If we missed the rally then is this the right time to get in?
NO change in below chart and all signs appears to be bullish for now.

Finally market has reached our target range so what shall we expect next!!! Will this market continue this rally or Is this the time to pullback!!!
Weekly chart to our rescue, giving us subtle clues. Check TOP tails on recent bars in below weekly Nifty chart, which would suggest possible pullback or sideways action in coming weeks. Such an action would be good for BULLs and can offer staging until results are out. If results are favorable to market then that would be our entry as it might start the next leg up, however if results are not as per expectations then expect market drift down to 6400 area. ONLY time will tell....

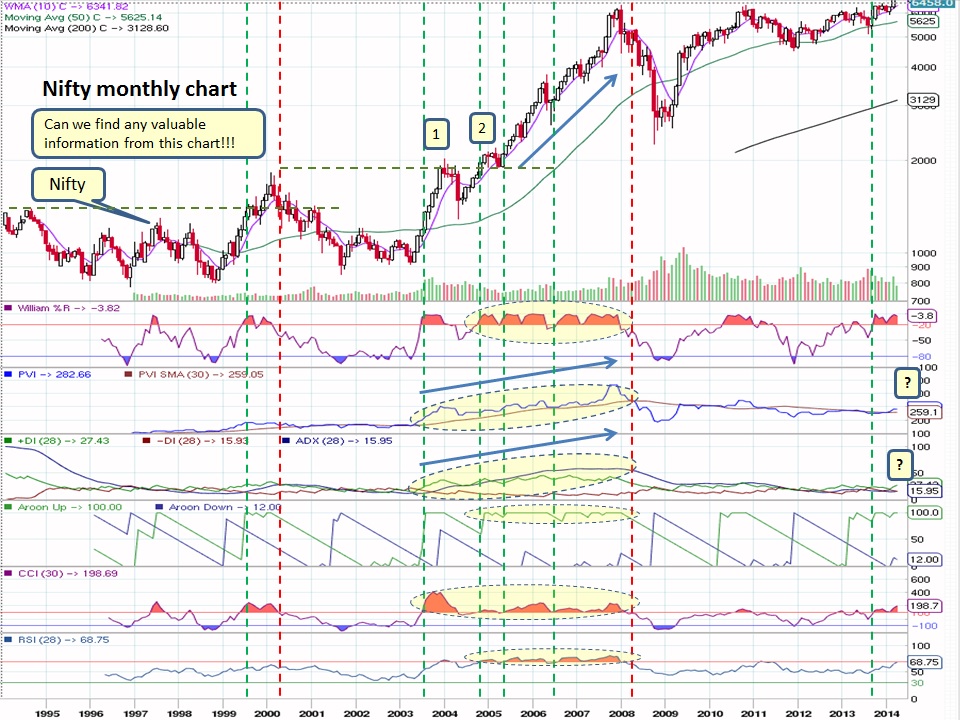
Lets take a look at monthly NIFTY chart with some interesting observations.
Period 1999 mid - 2000 mid:
It appears as if market will be starting BULL rally. Market made a new high, Williams %R in red, PVI trending higher, ADX line trending higher but at low levels, Aroon UP stays near 100, CCI in red, RSI trending higher. Time to get in?
BUT the rally is NOT sustained and market falls back, Williams %R drops, PVI is flat, ADX appears to be flat, Aroon UP drops, CCI drops. Time to get out.
Period 2003 end - 2004 start: Shown as no. 1
Market again near ALL TIME HIGH. Williams %R in red, PVI trending higher, ADX line trending higher, Aroon UP stays near 100, CCI in red, RSI trending higher. Time to get in?
BUT then suddenly we get a pullback in mid 2004, you can call it a shakeout. All indicators drop at this point.
Period 2004 end - 2008 start: Shown as no. 2 Massive BULL run no one wants to miss
Market again near ALL TIME HIGH. Williams %R in red, PVI trending higher, ADX line trending higher, Aroon UP stays near 100, CCI in red, RSI trending higher. This is definitely time to get in this rally. Also numerous opportunities were available to get in the rally when market pulled back briefly to wma(10).
Near end of 2008 market experiences an initial massive pullback. That's our warning shot, after a sideways move market crashes, Williams %R drops, PVI is flat, ADX appears to be flat, Aroon UP drops, CCI drops, RSI drops. Time to get out.
Period 2013 end: Will this be next no. 1
Market again near ALL TIME HIGH. Williams %R in red, PVI started trending higher, ADX line started moving up, Aroon UP stays near 100, CCI in red, RSI trending higher. Time to get in?
If history is going to repeat than we shall expect a shakeout drop scaring everyone. ONLY time will tell...
Considering current market scenario, if you are already in the markets then enjoy till it lasts. If you are not invested in equities then have patience and wait for the next right opportunity. Timing is everything in making it BIG and remember capital preservation should be our highest priority.
What does it mean for our Investments?
Market remains bullish, a pullback can be expected...
What does it mean for our Investments?
- Mutual Funds - If invested in equities then stay put and wait for danger signs to get out. If in FDs/Liquid funds then stay put and wait for right opportunity to get in.
- Stocks - ONLY invest in strong patterns and do not forget STOP LIMIT in place. You might want to check out our trade size calculator techniques along with android app and our watch list.
Market remains bullish, a pullback can be expected...

 RSS Feed
