Market appears to have found the support after dancing around MA(50) for couple of weeks. But how long can this market continue to remain range bound!!!
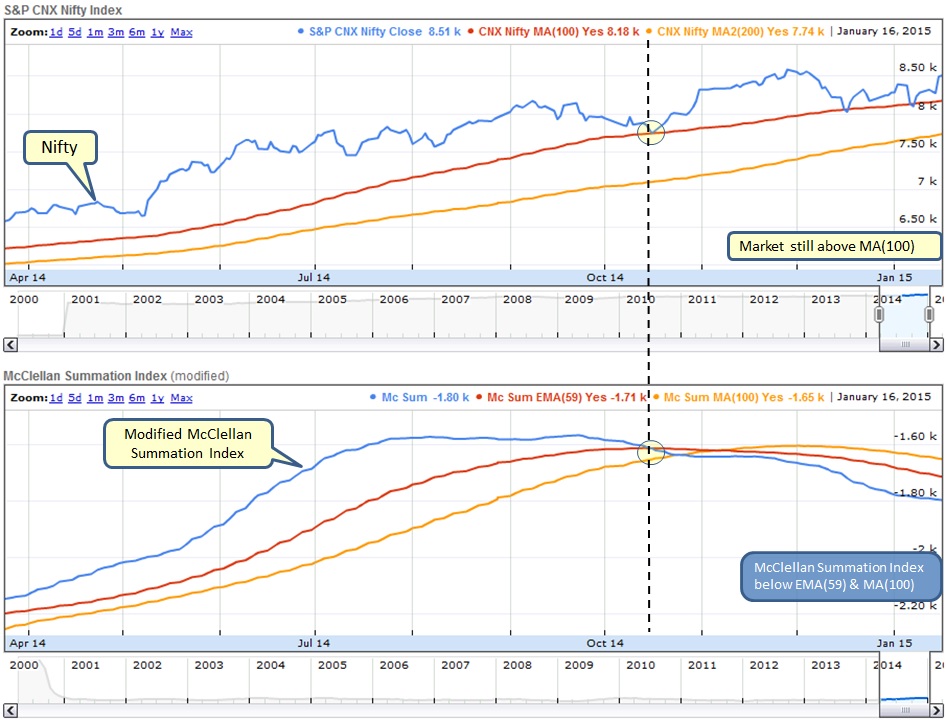
What is below chart telling us?
- Nifty has managed to stay above MA(100) and MA(100) above MA(200) - Benefit of doubt goes to BULLs
- McClellan Index below EMA(59) and EMA(59) below MA(100) - More stocks continue to decline compared to advancing stocks hence it is better to remain cautious
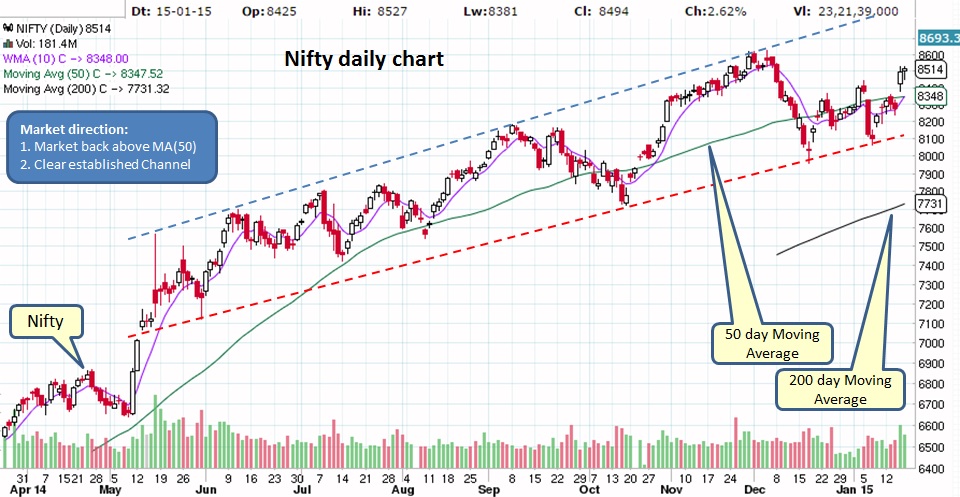
Clear establishment of the channel in below chart is very visible. This tells us that low risk entry is at bottom of the channel and if the channel is broken then its lot easier to exit with small loss. The Channel is in upward direction hence as long as market can remain above lower trend line of the channel, BULLs are in-charge.
Nothing changed in below chart as of now.
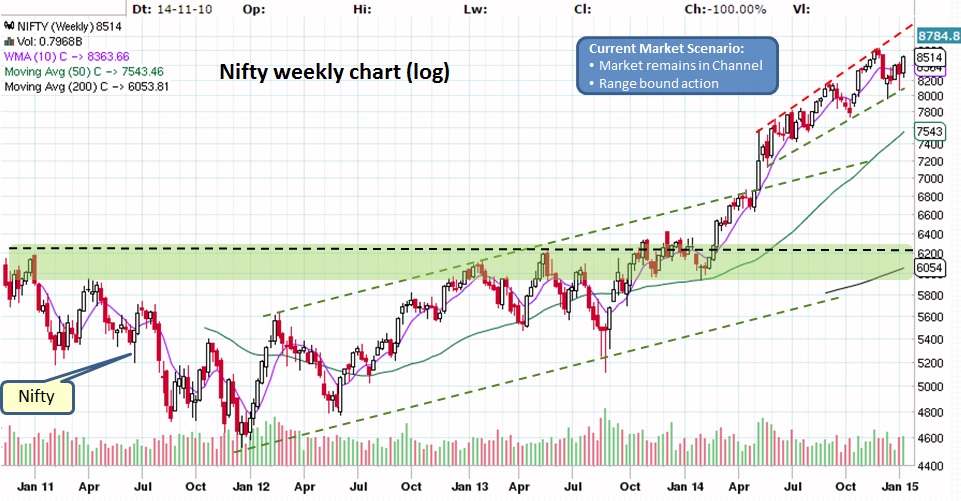
BULLs are in-charge for now based on the chart action, however lets not forget the caution signal provided by McClellan Index. Market can continue to remain in the channel for weeks/months ahead before we see an actual breakdown or turn around in McClellan Index. Just remember, anytime market is near lower trend line of the Channel, its time to be alert.
What does it mean for our Investments?
Market remains bullish and continues to be range bound...
What does it mean for our Investments?
- Mutual Funds - Stay invested in equities along with SIP if already in the market. If in cash/liquid funds/FDs then wait for next low risk entry.
- Stocks - ONLY invest in strong patterns but DO NOT forget to have STOP LIMIT on open positions. Check out our trade size calculator to manage risk per trade and also our watch list of potential BUY candidates might be useful.
Market remains bullish and continues to be range bound...

 RSS Feed
