Now that elections are out of the way, euphoria continues to take this market further high. New government is laying down its agenda of India's 1st bullet train, cleaning of river Ganga, re-settlement of Kashmiri pundits, so on and so forth. But what does all this mean for Investors and how far this market can continue its vertical climb?
No doubts about bullish sentiment here:
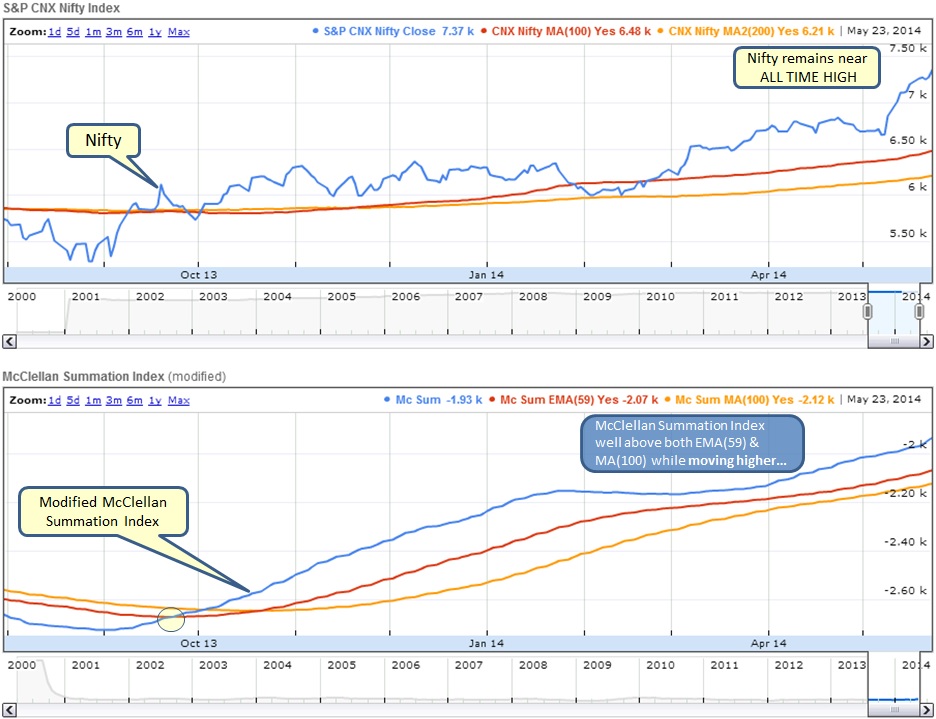
- Nifty well above MA(100), MA(100) well above MA(200) and all trending upwards
- McClellan Index well above EMA(59) and trending upwards
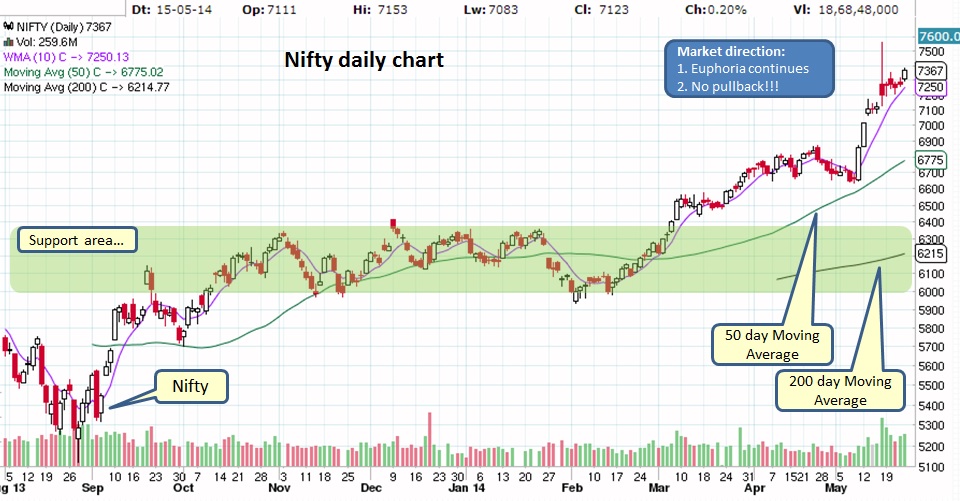
No one seems to get in the way of this massive rally. Market didn't even care to pullback or go sideways before the next leg up and at this point the rally is pretty much going vertical.
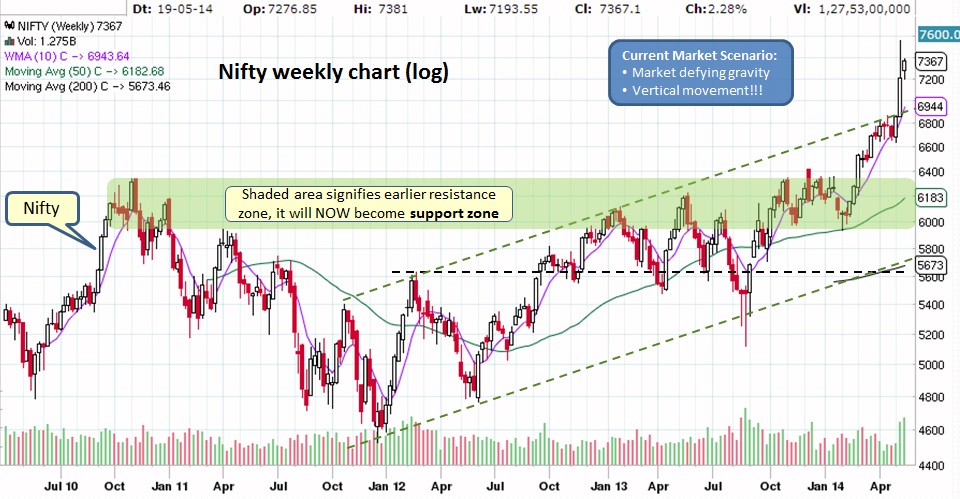
On weekly chart, we can see that the rally has moved this market from its original uptrend channel into new territory on higher volume which bodes well for this bullish action.
Lets take a pause here and think about below questions:
Now from a different perspective take a look at below monthly Nifty chart:
- Should we enter in this market now?
- How far do we think this rally can keep going?
Now from a different perspective take a look at below monthly Nifty chart:
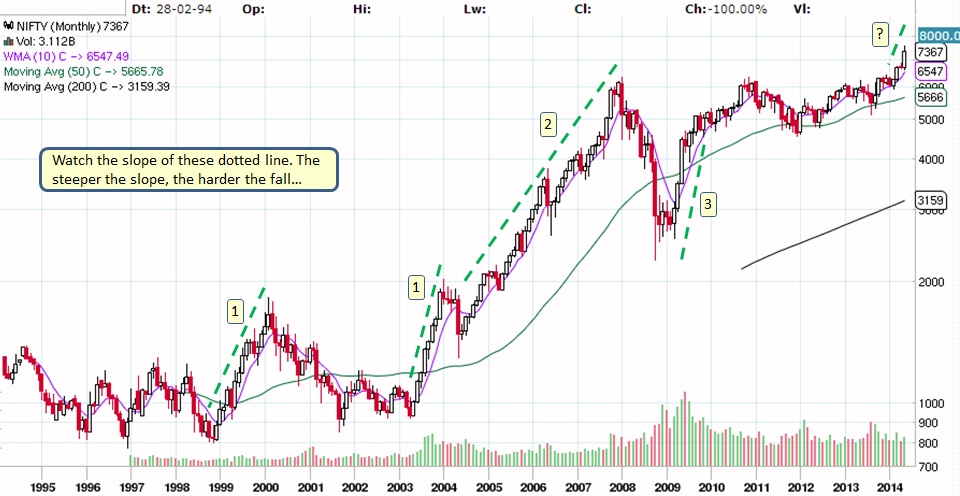
Take a closer look at "1" dotted lines, very steep slope moving upwards which is also very dangerous, WHY? Look what happened after the rally came to an end. Steep rallies are very hard to sustain and the eventual outcome is always horrible, hence exit strategy is very important. Now take a look at "2" dotted line, again a steep rally but the slope is not as steep as "1", also this rally started after breaking out to new high. Coincidentally Congress UPA government came into power 10 years back which gave birth to the massive rally between 2004-2007. During this rally shown by "2" dotted line, observe how market pulled back time to time, hence the rally was sustainable and Nifty went from 2000 to 6000, a gain of 300%. Now look at "3" dotted line, another very steep rally, however this rally came after a massive market collapse due to financial meltdown. Do observe what happened after the steep rally, it was hard for the market to keep going at same pace. Now look at "?" dotted line and ONLY time will tell which category it fits into. We hope it fits into category "2" dotted line which can take this market to 12000-18000 level in next 3-5 years, however for that to happen we need a good orderly pullback at some point in time.
Remember, a steep rally has a power to take any market up from 50% to 100% within matter of 8-15 months. It will NOT be a surprise if this market continues on this path and goes up to 9000 area in next 6 months. It is very bold statement yet very enticing to jump in this market, Isn't it!!! So what should we do?
If we simply cannot wait and we have to get in the game then the 1st thing to do is to SET a STOP LIMIT which means if the market takes a U-turn then we will NOT incur substantial losses. Also we can start investing through SIP. If we can wait and have patience (harder to implement) then we would like to see some consolidation or pullback on monthly chart. But it might be a while before we see some consolidation/pullback and might have to give up some gains for now.
What does it mean for our Investments?
Market in strong bullish bias for now....
Remember, a steep rally has a power to take any market up from 50% to 100% within matter of 8-15 months. It will NOT be a surprise if this market continues on this path and goes up to 9000 area in next 6 months. It is very bold statement yet very enticing to jump in this market, Isn't it!!! So what should we do?
If we simply cannot wait and we have to get in the game then the 1st thing to do is to SET a STOP LIMIT which means if the market takes a U-turn then we will NOT incur substantial losses. Also we can start investing through SIP. If we can wait and have patience (harder to implement) then we would like to see some consolidation or pullback on monthly chart. But it might be a while before we see some consolidation/pullback and might have to give up some gains for now.
What does it mean for our Investments?
- Mutual Funds - If invested then enjoy the gains, you may also might want to add to your position or start SIP. If NOT invested then consider starting SIP or invest say 10-25% to test waters. If you have patience then wait for the monthly consolidation but then you might miss some part of the rally.
- Stocks - ONLY invest in strong patterns, make sure you have STOP LIMIT in place. You may want to check our trade size calculator here.
Market in strong bullish bias for now....

 RSS Feed
