After being range bound for several months, market broke the support at 15600 briefly in June and managed to reclaim it by end of the month. But can it hold it going forward or we are doomed!!! Lets understand if charts are providing any clues...
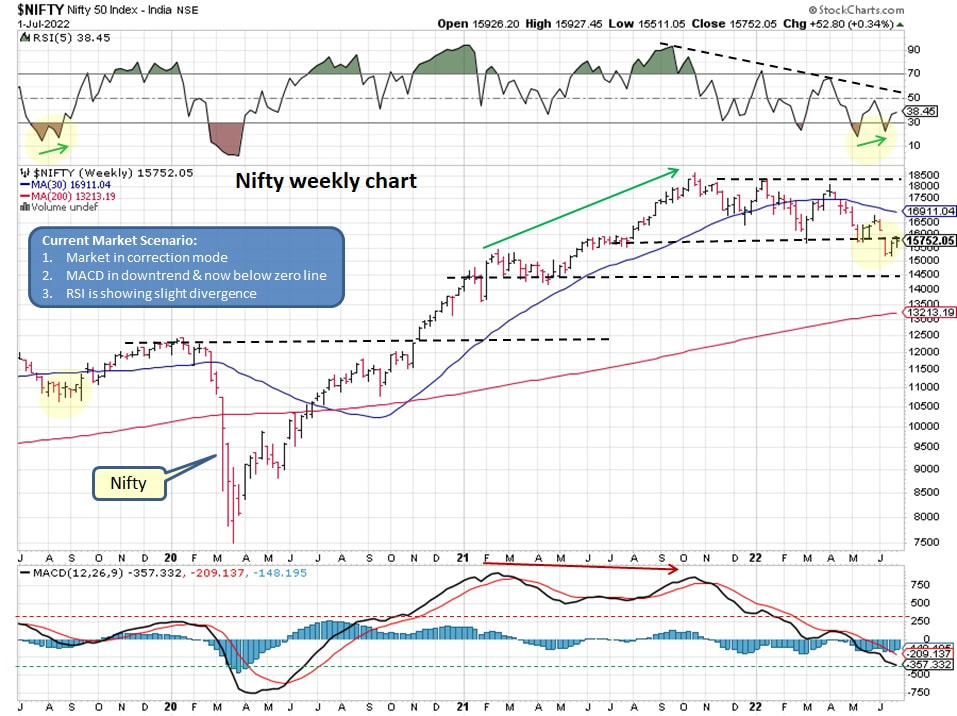
Weekly Nifty chart below provides an important clue, Can you spot?
- MACD is still trending down and below zero
- RSI is also below 50 mark, however we can see a divergence forming with Nifty level suggesting a potential bounce
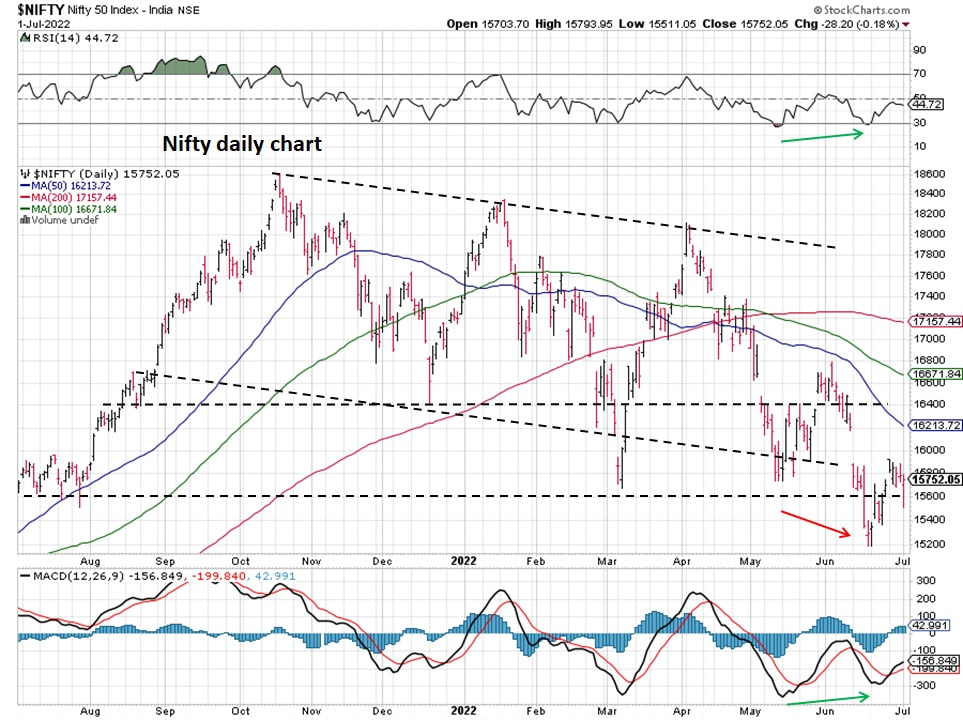
Daily Nifty chart below is also providing two important clues:
- MACD is below zero mark, however we can see a divergence forming with Nifty price suggesting potential bounce
- RSI is also below 50 mark, however we can see a divergence forming with Nifty price suggesting potential bounce
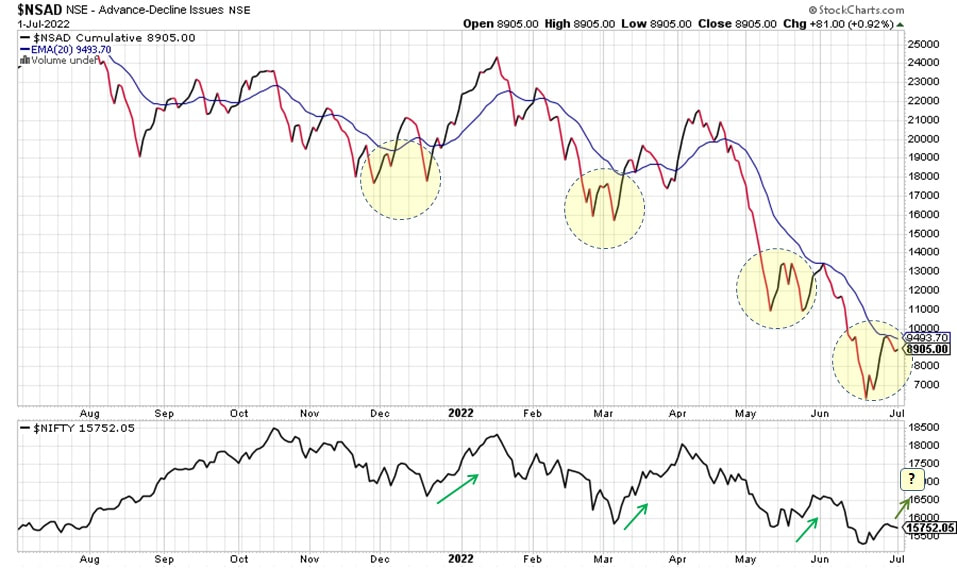
Can you figure out a pattern in below Nifty Advance-Decline cumulative chart?
- Every time we get a double bottom formation in NSAD, we tend to get some bounce in Nifty
- The magnitude of the bounce depends on NSAD crossing above EMA(20)
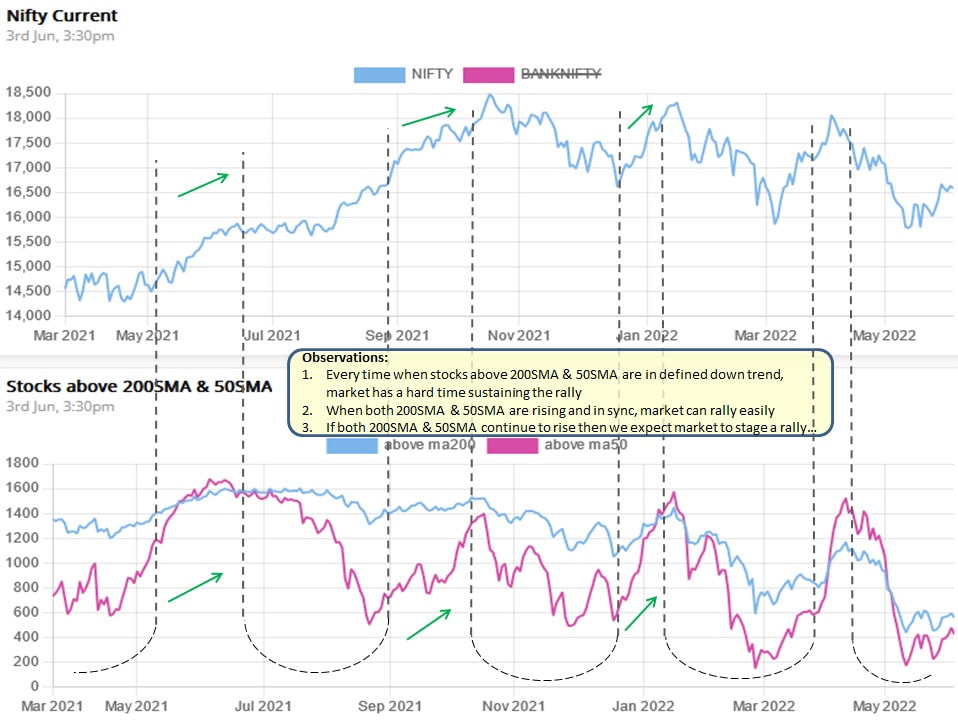
For any bounce or rally to successful, more stocks needs to participate in the rally, Isn't it?
Based on above charts we can summarize as below:
Market in correction mode, be cautiously optimistic.
- Probability of a bounce is increasing
- Magnitude of the bounce shall be decided by broad participation of stocks
- Nifty has a good chance to manage a rally towards 16400-16600 area
Market in correction mode, be cautiously optimistic.

 RSS Feed
