Market could not sustain the breakout to all time high in Dec 22 and now back in the range. What can we expect next!!!!
Let's see if charts are providing any clues.
Let's see if charts are providing any clues.
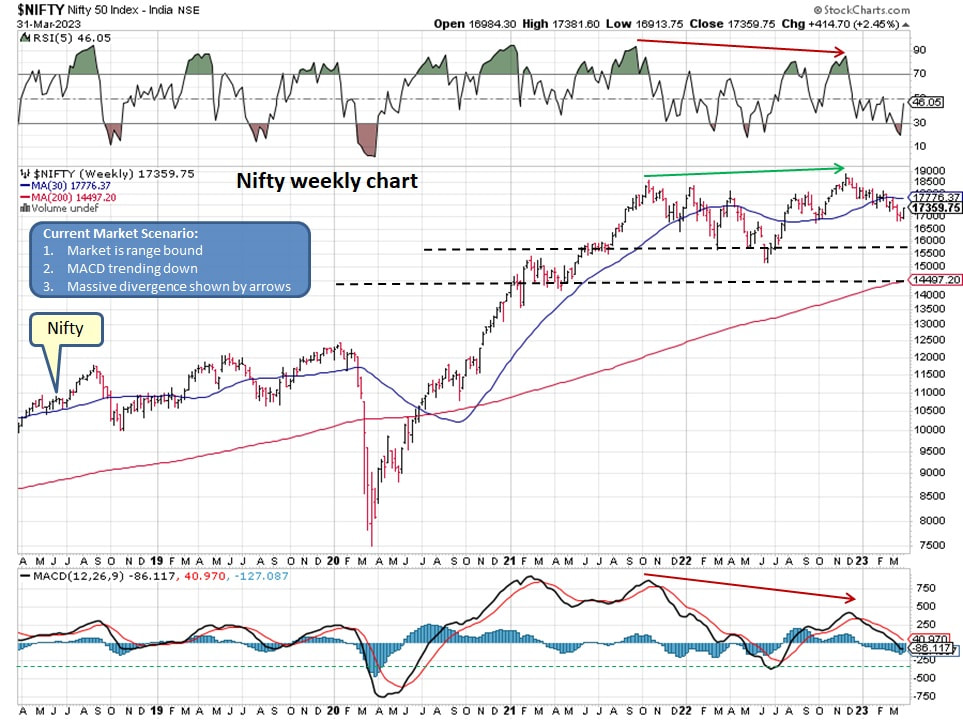
Weekly Nifty chart below displays divergence between Price and RSI as well as MACD, No other clues are available from below chart.
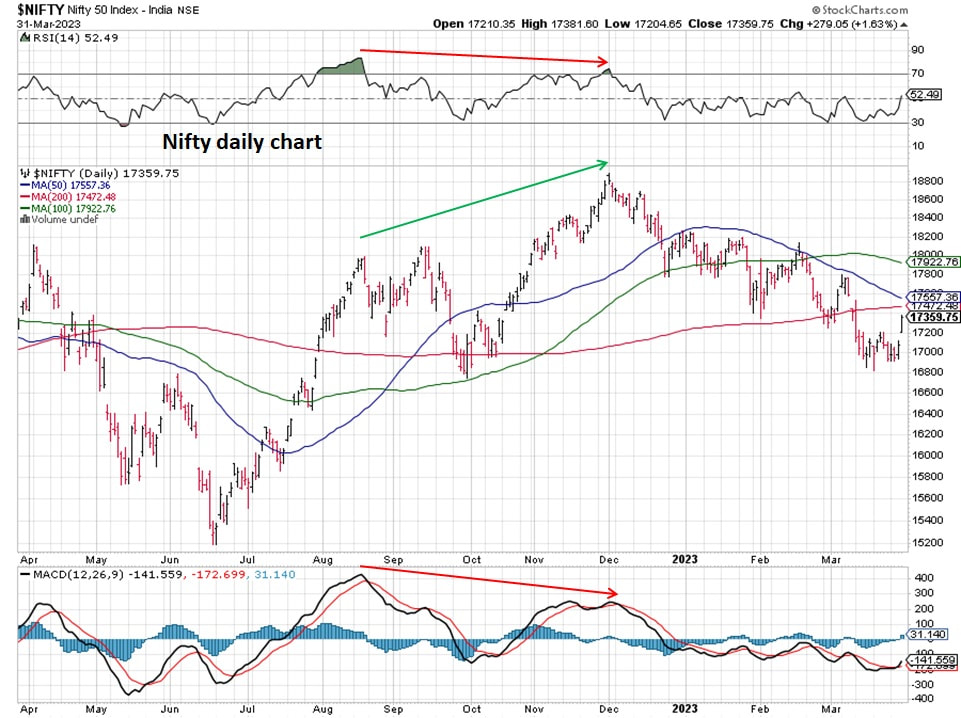
Daily Nifty chart is displaying that Nifty is below 50day, 100day and 200day moving averages suggesting lot of overhead resistance.
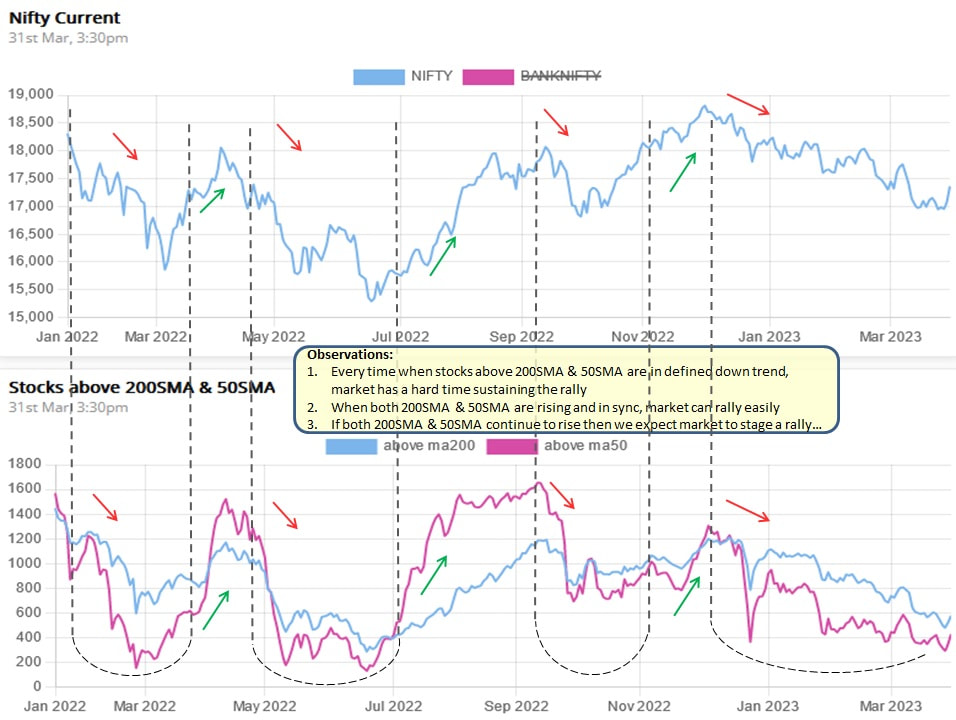
Below chart is providing some clues, can you figure it out!!!
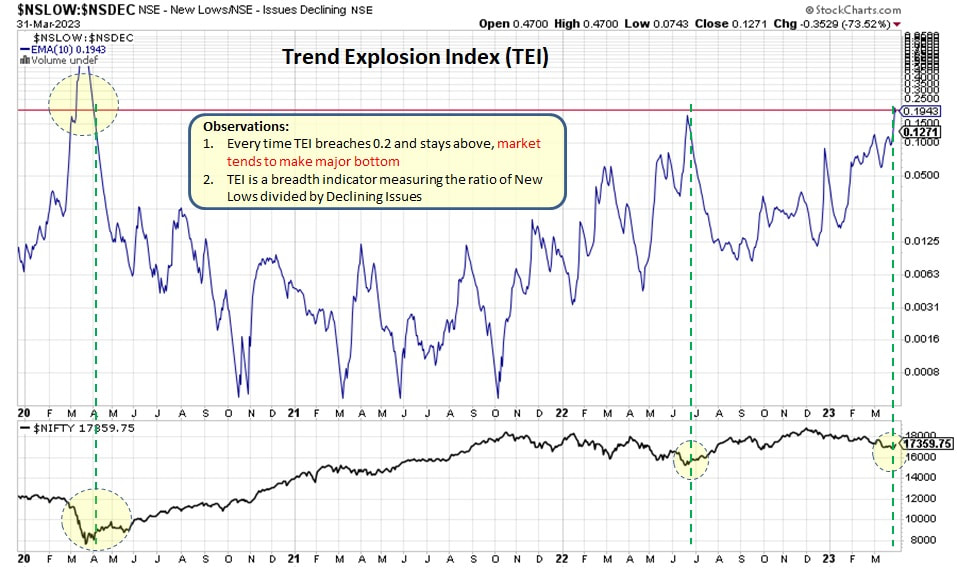
Below chart is also known as Trend Explosion Index which is a breadth indicator. It might be suggesting that a possible bottom is near....
Summary:
Market remains range bound, better to remain cautious...
- Market continue to be range bound
- Subtle clues are available in two charts
- Stocks above their respective 50day and 200day moving averages appear to be turning around
- Trend explosion index has reached an area, turn around from this area could potentially suggest a market bottom
Market remains range bound, better to remain cautious...

 RSS Feed
