Were you anticipating this market bounce? Were you able to identify the warning signs before the swift market drop to MA(50)? Read our previous blog post and understand how we identified the warning signs. It appears like the market rally is resuming but is it for real? Lets check out what charts are telling us.
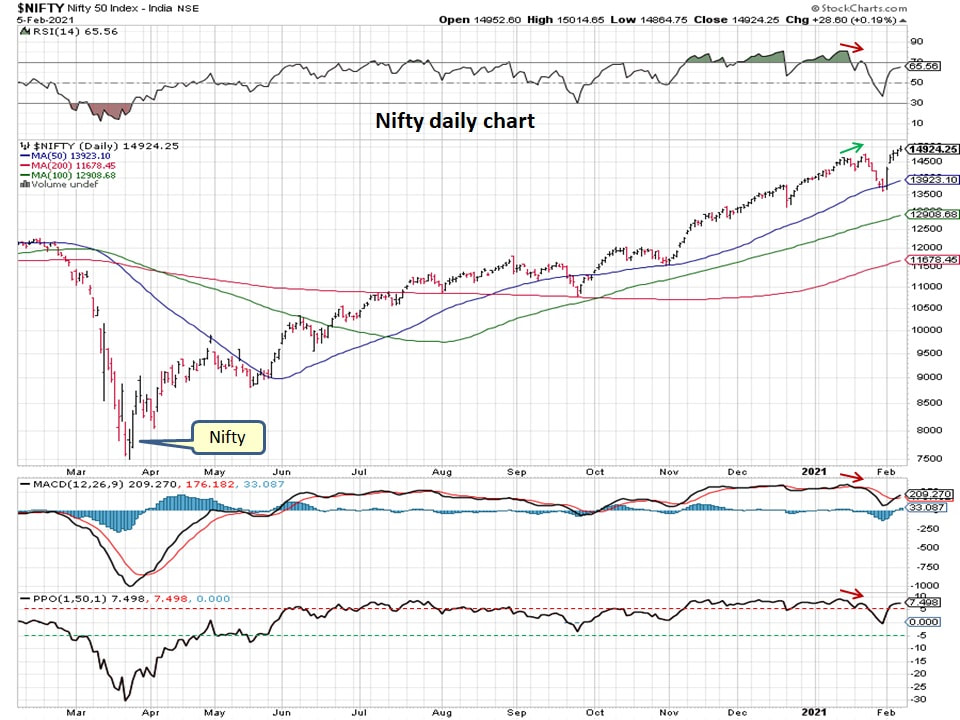
Daily Nifty chart below shows how market swiftly dropped to MA(50) and bounced off of the 50 day moving average quickly as well. It is a good sign, however it does not tell us anything about market internals as in how strong the market internals are and will this rally be sustained!
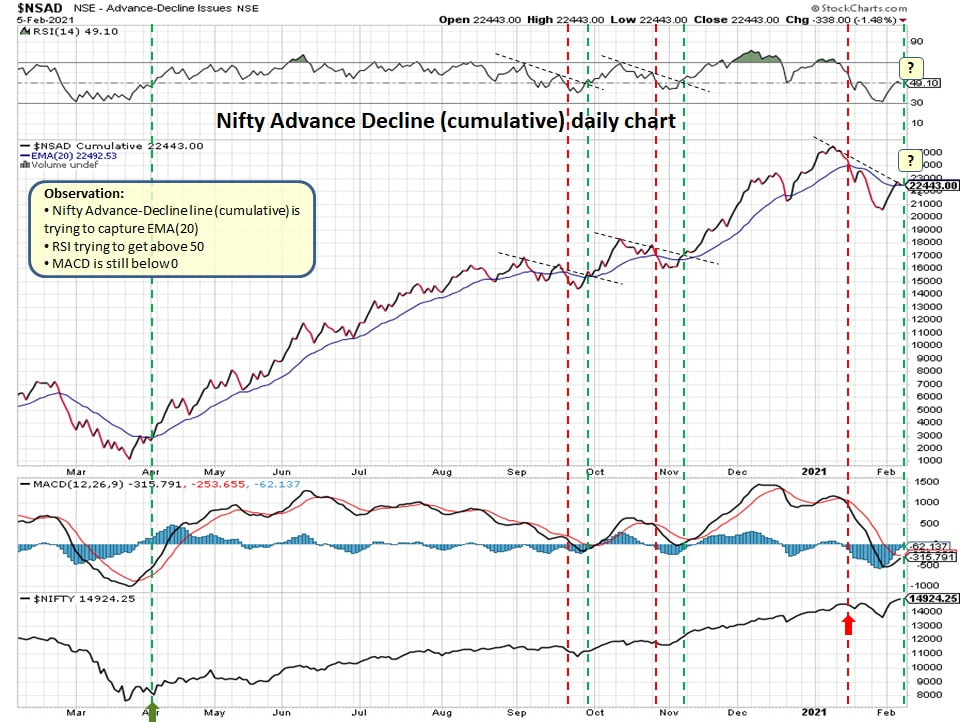
Market internals are shown by market breadth indicators and Nifty Advance Decline line (NSAD) shown below is one such indicator. As we can see, NSAD appears to be recovering and trying to get back above EMA(20), next week shall reveal if it can rally above EMA(20) which would suggest that market internals are improving.
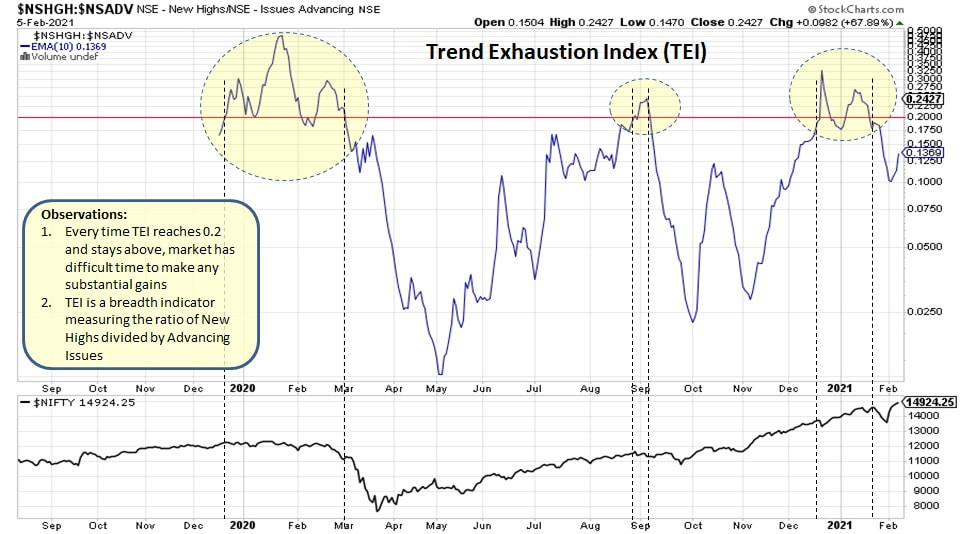
Trend exhaustion indicator is another market internal breadth indicator and appears to have dropped below 0.2 suggesting market internals are not stretched as it were earlier.
Remember, market breadth indicators are to be used as market thermometer. As long as the thermometer is not too heated markets are healthy, the moment thermometer starts becoming hotter then its time to be cautious. Market appears to be gaining its footing and bull rally appears to be continuing further in other words we might be able to find more stock setups if the rally is real. Also, if US passes another Covid rescue package deal then liquidity will flow into US markets which might help Indian markets too and add fuel to this rally further. Stay in the game but don't be the last one holding the bag...
Market remains bullish for now...
Market remains bullish for now...

 RSS Feed
