Market has been quietly consolidating these past two month near resistance trend line. How long before its breakdown or breakout!!! Lets check if charts are providing any clues so we can align our ducks...
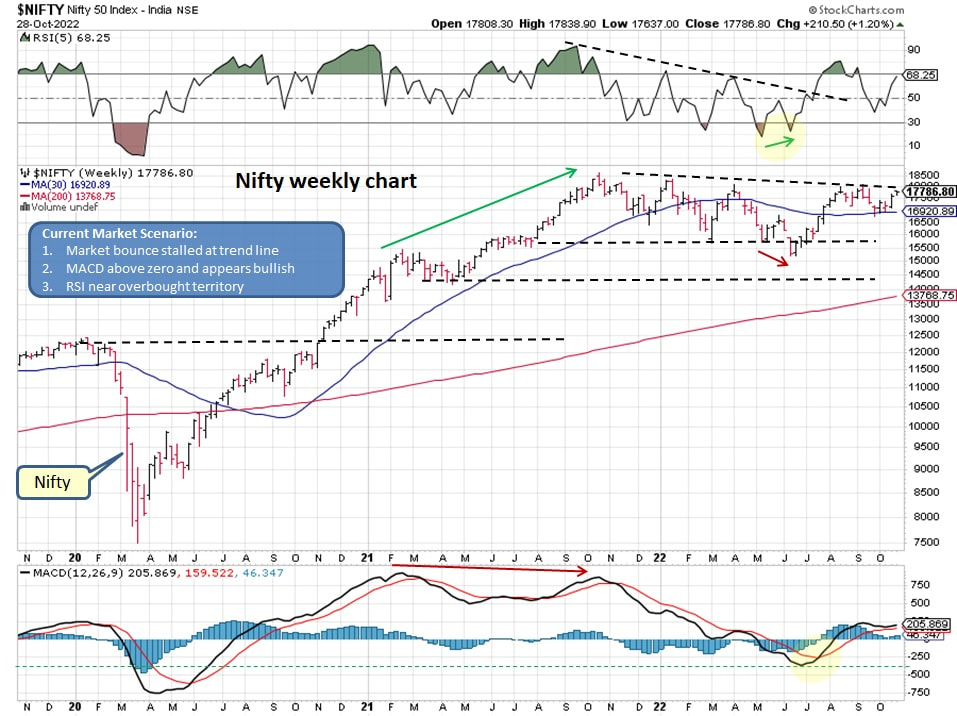
Nifty weekly chart is displaying nice consolidation range bound action while it stays above 50 major moving averages:
- RSI is moving towards overbought territory
- MACD is above zero mark and appears to bullish
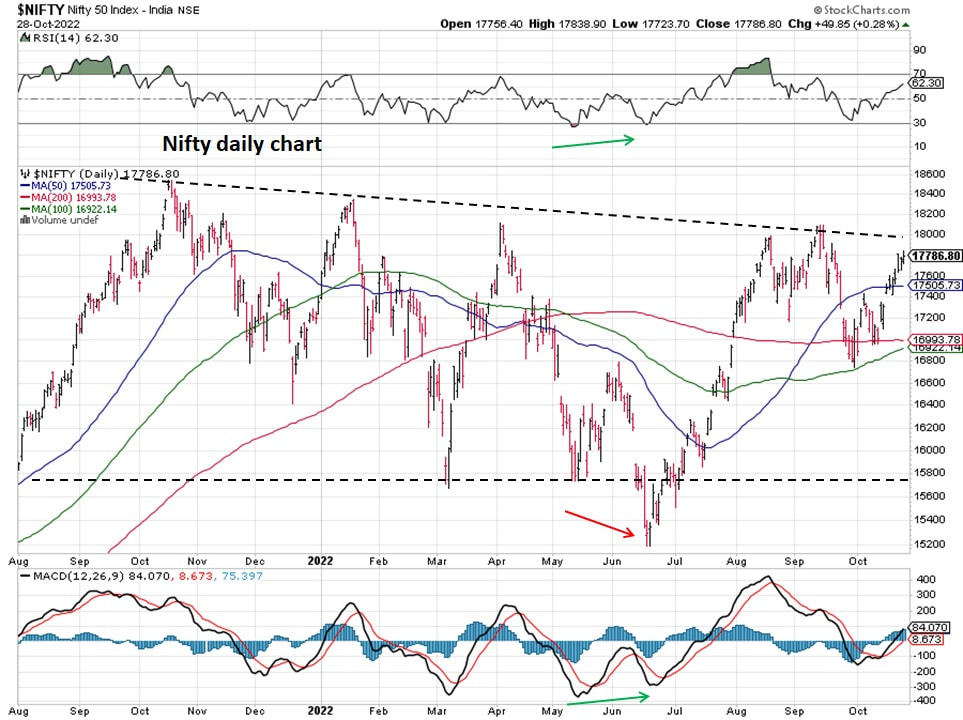
Daily Nifty chart shows how Nifty is pinned down below resistance trend line.
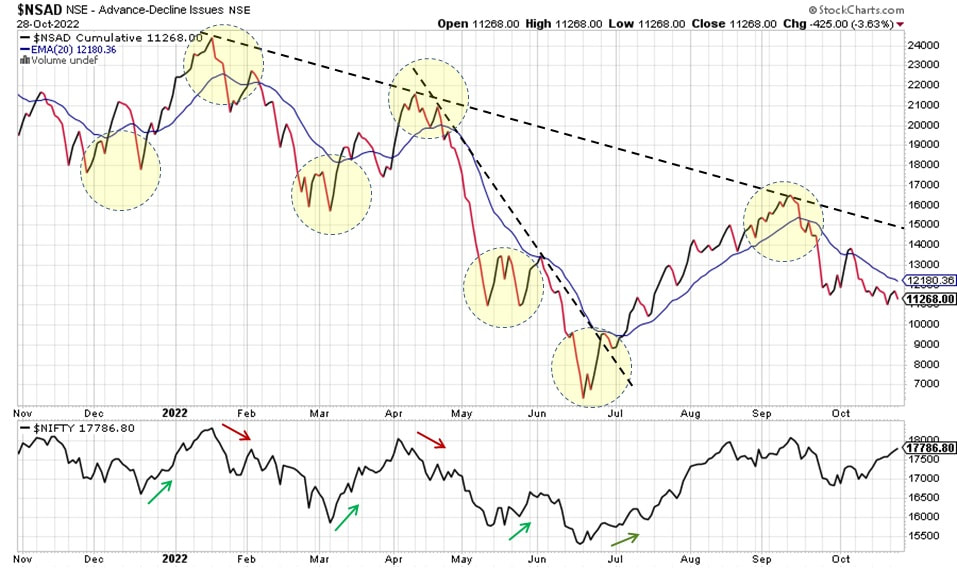
Nifty advance decline line needs to break the overhead trend line for breakout confirmation.
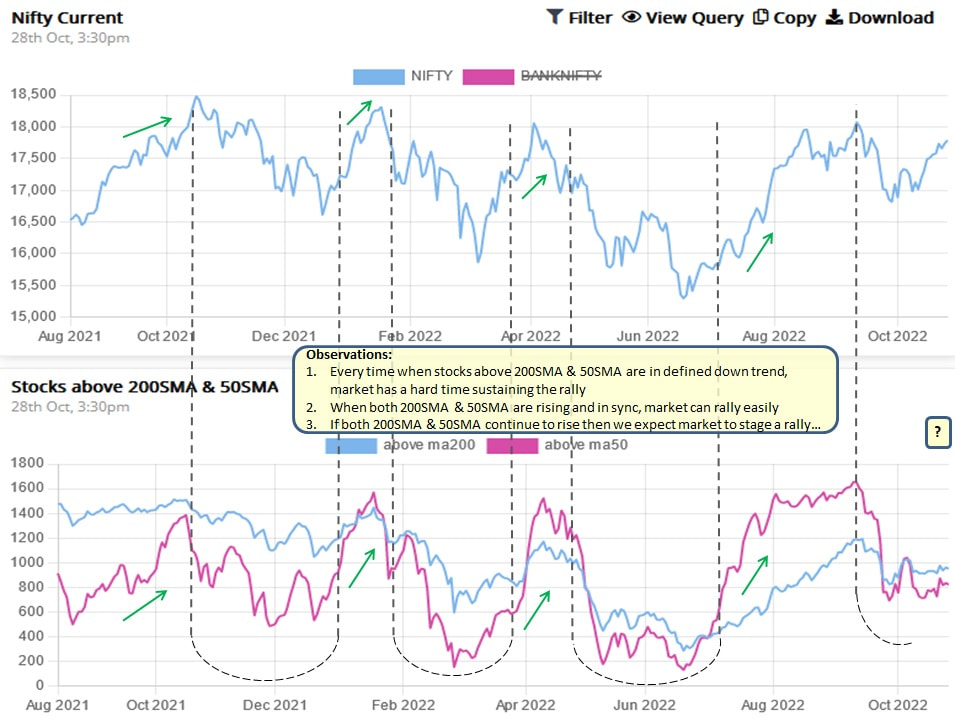
Below chart is providing the best clue out of all the charts so far. Once the stocks start moving above their respective 50D SMA and 200DMA then Nifty breakout is inevitable.
Market appears to be waiting for the right conditions to start its next bull run and we might be at that very junction! Ofcourse no guarantees but odds might be favoring and leaning towards bull side, time shall reveal. Are you ready and aligned!!!
Market remains range bound but has bullish bias...
Market remains range bound but has bullish bias...

 RSS Feed
