Past week, market enjoyed the Santa and year end rally, however will it continue into New Year? Are we out of the woods? Is bottom behind us? Let's hear what charts have to tell us....
Daily Nifty chart below is giving us a pretty big clue:
- MACD is below zero mark and appears to have formed double bottom!
- RSI has managed to move above 50 mark
- PPO is neutral
- Nifty has overhead resistance of 50MA and 100MA but also appears to have found support at 200MA

Weekly Nifty chart is giving us a bigger perspective:
- Nifty appears to be consolidating after a nice bull run and may be ready for next lift off!
- MACD is forming double top or bearish divergence
- PPO is showing bearish divergence
- RSI is neutral

Nifty advance decline line appears to be improving but needs more work and certainly needs to breach the dotted red trend line for any meaningful sustained rally.

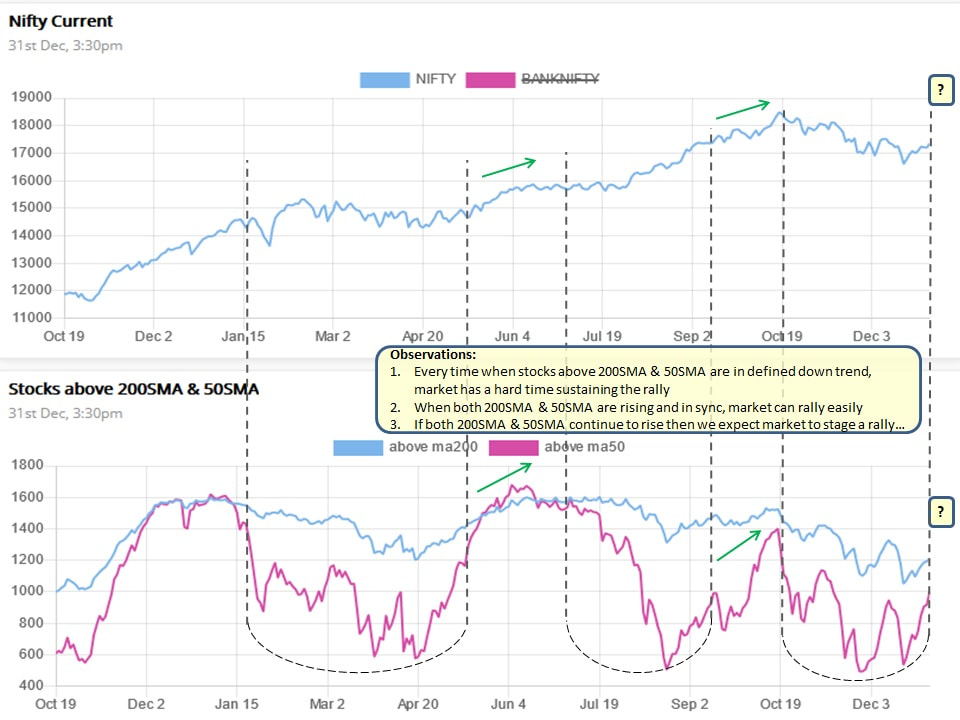
Stocks above 50SMA appears to be improving but needs more work while stocks above 200SMA still in downtrend and needs lot more work. If both lines starts rising then it improves probability of market rally.
Overall, it appears like things are improving and underlying currents are changing, however will the change be enough for market to stage a bounce (before drop) or full blown another bull rally will only be determined by how strong the change will be! Long term outlook does not look very appealing at this time as weekly chart are displaying divergences.
Stay cautious and get ready for the ride...
Stay cautious and get ready for the ride...

 RSS Feed
