How many of you did not pay attention when we said "expect pullback or sideways action" in our last blog post. The key here is to understand why did we say it!!! We do not have magic ball and yet we could read the signs ahead of time, BUT HOW? well time to pay attention so that we can make better judgement and eventually prudent investment/trading decisions.
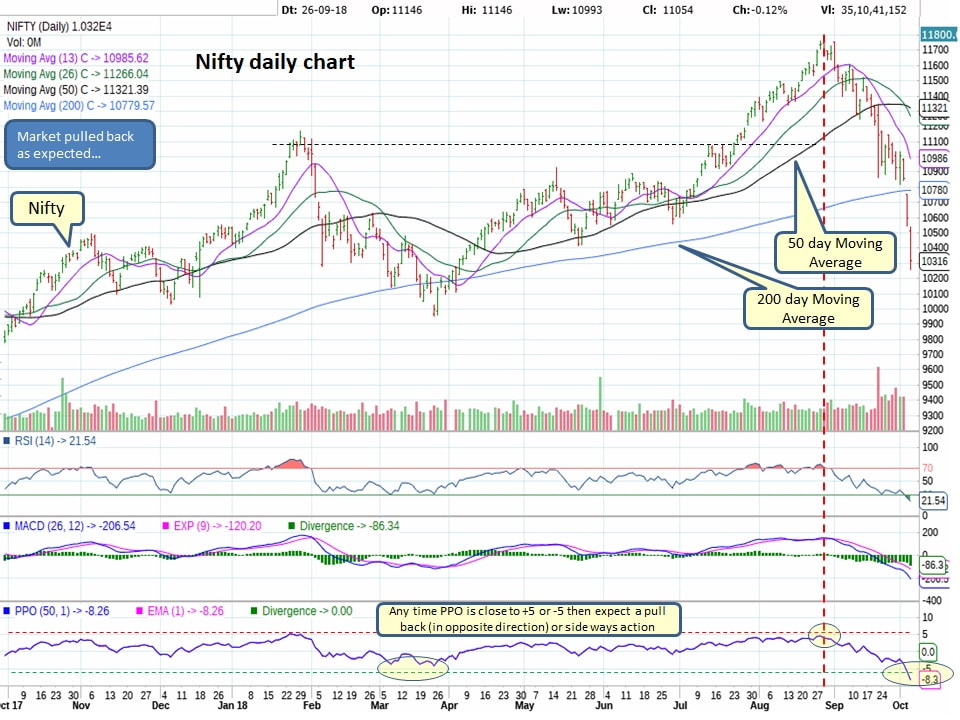
Observe below Nifty daily chart near RED vertical line, Is it trying to tell us something?
Now check the same chart below in October:
- PPO is very close to +5 mark suggesting be cautious as market is stretched above 50 day moving average and may need to cool down
- RSI into overbought territory suggestion a possible short term pullback
- MACD flattening
Now check the same chart below in October:
- PPO well below -5 suggesting expect a bounce in near term
- RSI also into oversold territory suggesting possible bounce in short term
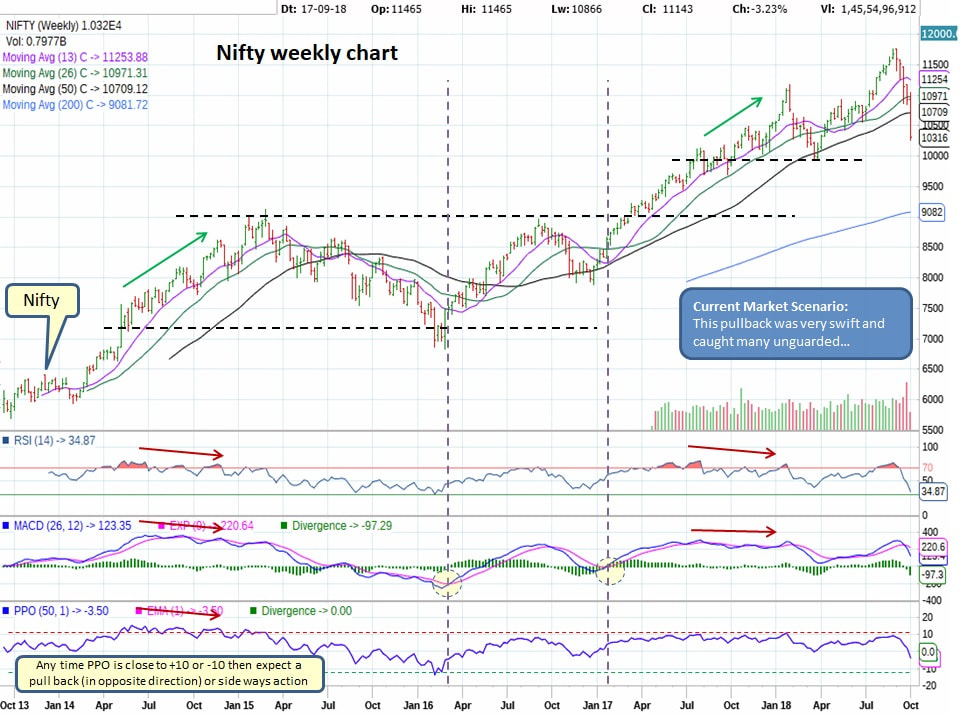
Did weekly chart provide any clues?
- PPO was very close to +10 suggesting possible pullback or sideways action
- RSI well into over bought territory suggesting a possible cool down
- As soon as MACD crossed, this was another warning sign things could get ugly
OK, So now we got a swift pullback, Is the pain over OR more to come?
Good luck!
- We might get a oversold or over-reaction bounce but the strength of the bounce shall reveal the next probable move
- Unfortunately market broke the 200 day moving average support and now has to over come the resistance
- Also the support near 10,800 area has become the new resistance for the market
- After initial bounce is completed and if the resistance near 10,800 stays then market may drift lower to 10,000 area where we have next support
- Market needs to establish a support zone which means expect some range based action unless we get a V shape recovery similar to what we saw in April 2018
Good luck!

 RSS Feed
