Our apologies for not posting last weekend due to site related issues. We hope everybody had a wonderful Christmas and wish you all a safe and prosperous New Year ahead.
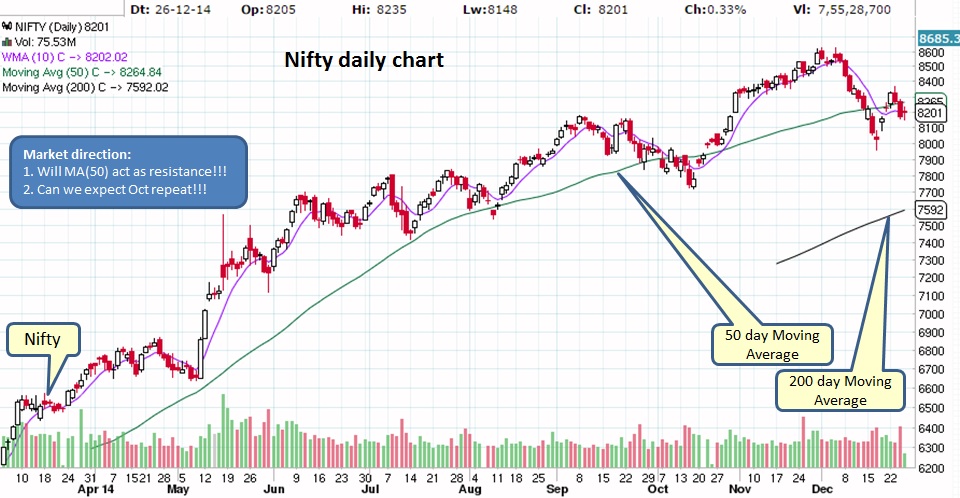
Market is struggling hard to hold onto the support near MA(50). Will we see repeat of Oct 2014 or will it be different this time!!!
Market is struggling hard to hold onto the support near MA(50). Will we see repeat of Oct 2014 or will it be different this time!!!
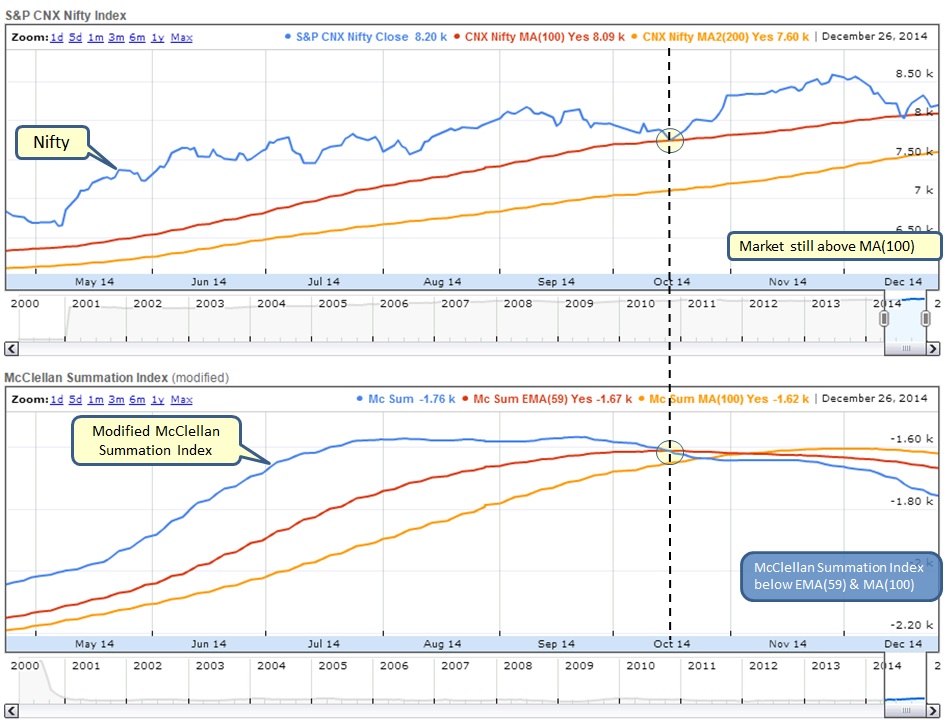
What is below chart telling us?
- Nifty still above MA(100) while MA(100) above MA(200) & both trending higher - All signs suggest bullish sign for now
- McClellan Index is trending down while remaining well below EMA(59) & MA(100) - suggesting more no. of stocks are declining then advancing
Nifty daily chart shows that, market is having hard time to hold onto the MA(50) support area. Will it get enough strength to rally back up remains to be seen. If market does decide to take a dive then next solid support will be near MA(200) area.
Weekly chart suggest that market is moving in a bullish channel (shown by dotted red lines), as long as it stays in the channel then benefit of doubt goes to bulls. However, divergences are very visible as shown by red arrows, also as long as weekly RSI remains above 50, benefit of doubt goes to bulls.
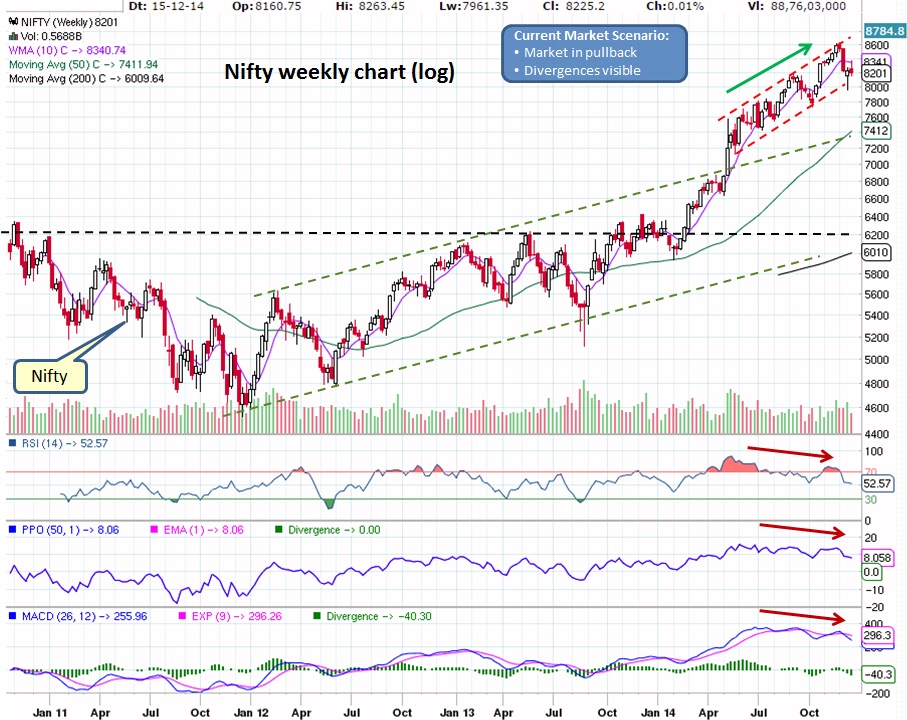
Charts are telling us to be cautious as any rally from this point onward may not go far unless no. of stocks advancing is consistently more than declining stocks. Also market can remain in the channel/range for many weeks/months before the actual breakdown occurs.
What does it mean for our Investments?
Market in pullback but remains bullish for now...
What does it mean for our Investments?
- Mutual Funds - Stay invested if already in equity funds and no need to discontinue SIP. If in cash/liquid funds/FDs then watch for a low risk entry (especially if market starts moving up) but be ready to pull the plug.
- Stocks - ONLY invest in strong patterns and do not forget to have STOP LIMIT for any open positions.
Market in pullback but remains bullish for now...

 RSS Feed
