As range bound market gets toward all time high, are we ready to break the resistance! Are market internals aligned to support this move!!! What can we expect next?
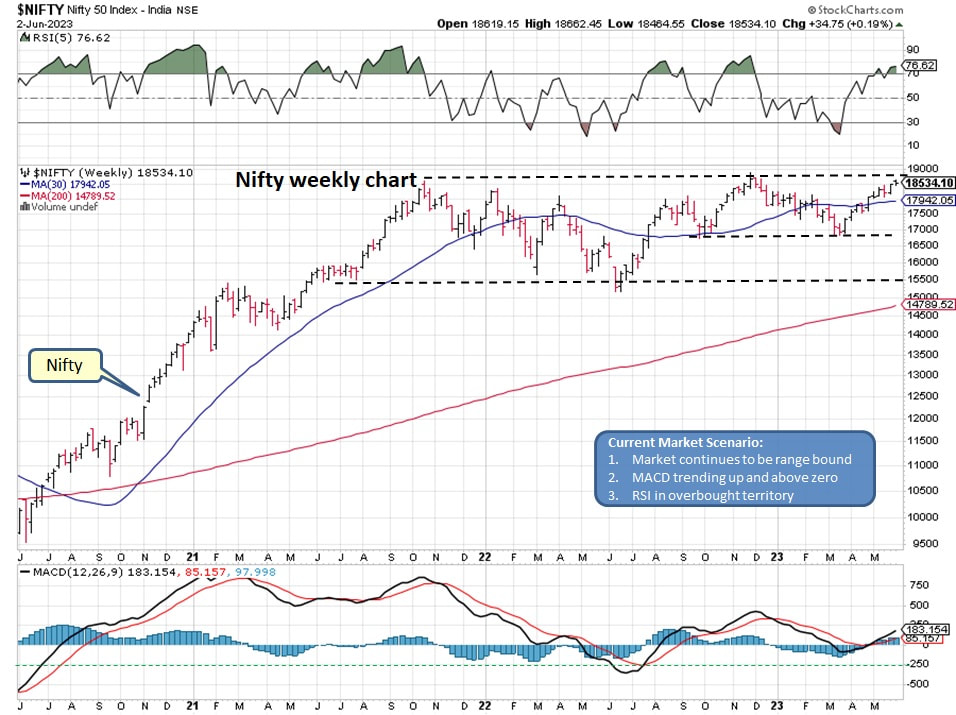
Below Nifty chart is providing following clues:
- RSI is currently in the overbought zone, which suggests that the market may be due for a pullback.
- MACD is in a bullish trend, which suggests that the market may continue to rise in the near future.
- Also lets not forget that market is at all time high resistance level near 18600.
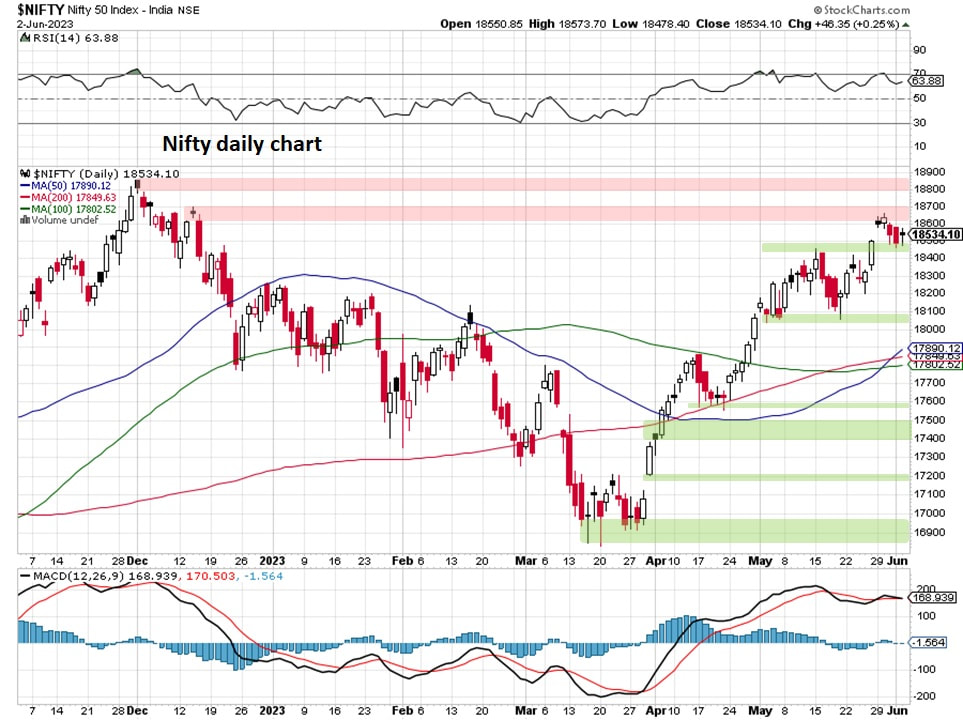
Below daily Nifty chart is providing following clues:
- RSI is above 50 mark suggesting bullish action.
- MACD is in a bullish trend, but it is starting to flatten, which suggests that the market may be reaching a local top.
- Also resistance areas are visible in this chart.
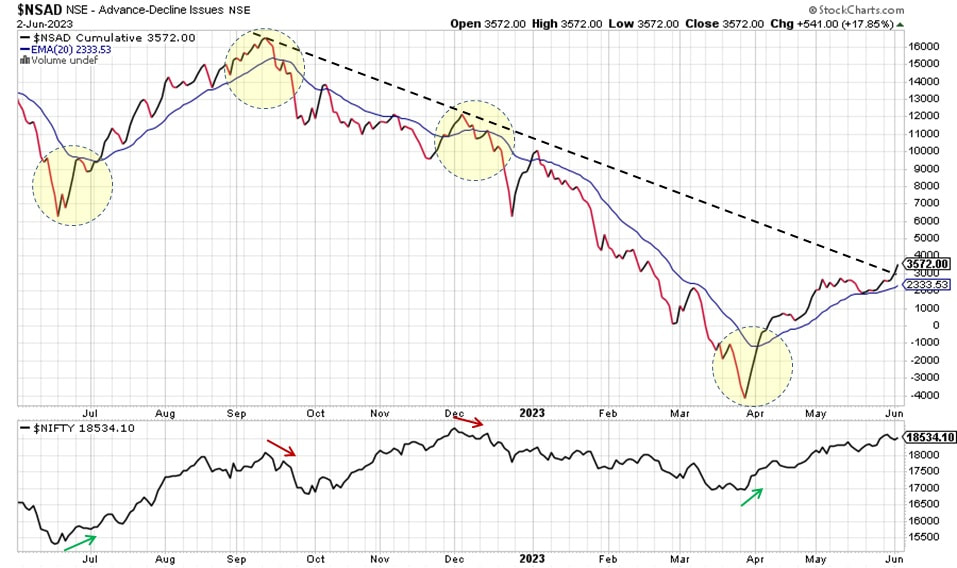
The Nifty cumulative advance-decline line is currently in a bullish trend, which suggests that the market is seeing more advancing stocks than declining stocks. The line is also rising at a faster pace than the Nifty index, which suggests that the market is gaining momentum.
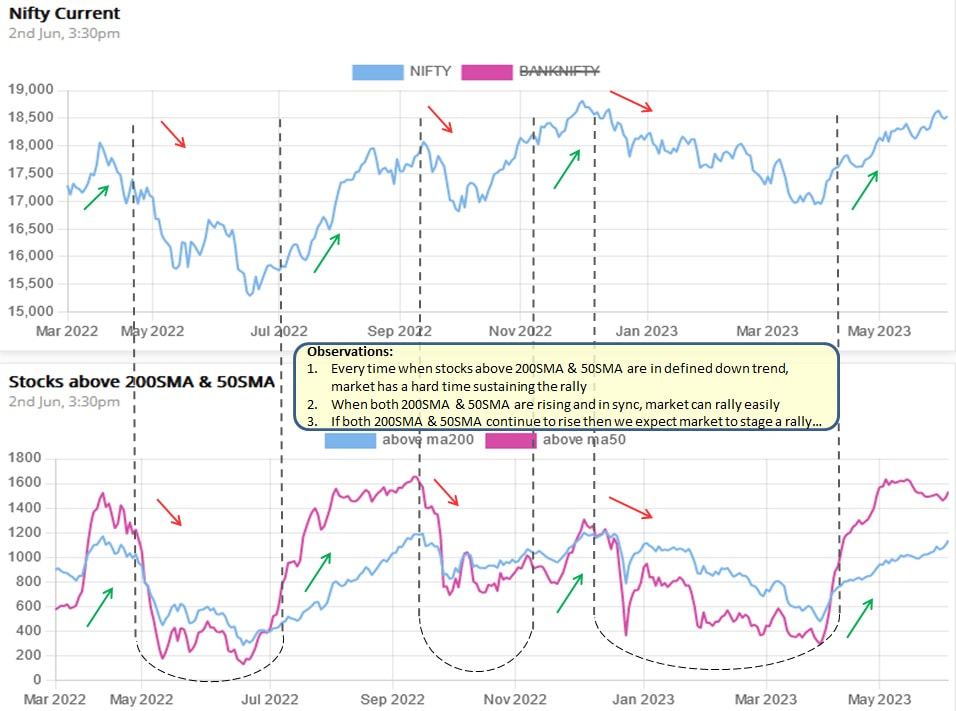
A majority of Nifty stocks are trending above their 50-day and 200-day simple moving averages (SMAs), which is a bullish signal. This suggests that the overall trend in the market is positive and that prices are likely to continue to rise in the near future.
Summary:
The Nifty is currently in an uptrend, with a majority of stocks trading above their 50-day and 200-day simple moving averages (SMAs). The cumulative advance-decline line is also rising, which suggests that the market is seeing more advancing stocks than declining stocks. The Nifty chart shows that the market has been rising in a steady trend over the past few months, with occasional pullbacks. Overall, the technical indicators suggest that the Nifty is in a bullish trend and could continue to rise in the near future. However, the biggest obstacle is the all time high resistance.
Market remains cautiously optimistic but be vigilant...

 RSS Feed
