Wish you all a very prosperous New Year ahead.... :-)
New beginning means an opportunity to take a big picture view and adjust your portfolio accordingly. What does this really mean?
So what do you think will happen in 2016?
New beginning means an opportunity to take a big picture view and adjust your portfolio accordingly. What does this really mean?
- Understanding market direction - Probability or likelihood where this market can go in year ahead
- Understanding where to put your money to work for you - Based on probable market direction where would you invest? In equities, debt or balance funds or ETFs?
- How do we go about finding these funds once we know which investment category we want to invest?
- Above all how do we protect our money from global turmoil!!!
So what do you think will happen in 2016?
Let's see if we can identify following:
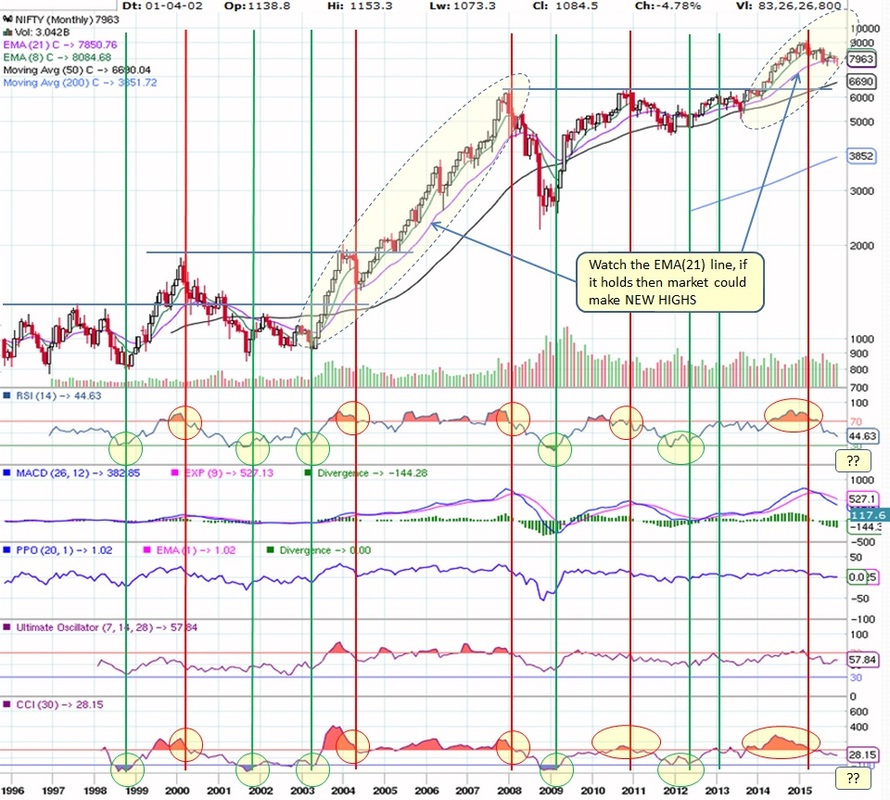
Take a look at below monthly Nifty chart.
Pay special attention to RSI & CCI. You don't need to worry about what each of those mean, just understand the chart action.
THIS IS VERY CONFUSING... well just observe the below chart carefully and soon you shall understand the relationship.
- Will this year be good or better for markets than last year?
- Are equities way to go or shall we consider debt funds or balanced!!!
- Is it wise to invest in Mutual Funds now? or is ETF a better option!!!
- Where to put our money to work for us?
Take a look at below monthly Nifty chart.
- Green lines - Suggests market is about to make a move higher
- Red lines - Suggests market is about to turnover and start moving down
Pay special attention to RSI & CCI. You don't need to worry about what each of those mean, just understand the chart action.
- CCI - Any time, it goes below -100 and moves back up, typically suggests that market will start moving higher. On the other hand, if it goes above 100 and moves back below that level, typically it means market will roll over and start going down.
- RSI - To be used in conjunction with CCI. Any time, it goes below 30 and moves back up, typically suggests that market will start moving higher. On the other hand, if it goes above 70 and moves back below that level, typically it means market will roll over and start going down.
- PPO - Check the period from 2003 - 2008, PP never dropped below zero mark. Something to keep an eye on!
THIS IS VERY CONFUSING... well just observe the below chart carefully and soon you shall understand the relationship.
Now that you got a chance to look at the above chart....
What can you say about market direction in 2016? (Look at 2016 period which is on extreme right side)
Once RSI goes above 70 and CCI goes above 100, market continues to climb for next 3-8 months and then roll over. You can see this in above chart and it is consistent for last 15 years. However 2005 to 2008 is an exception as we were in MEGA BULL market but otherwise that has been the pattern.
Look at the horizontal line:
Every time market breakout to all time high, it came back to test the breakout level before continuing the move higher. However, this may not happen always in a MEGA BULL market scenario.
How will this analysis help us to invest for long term?
Typically, we invest in Mutual Funds OR Tax Saver Funds at the beginning of the year.
Look at above chart near beginning of 2000, 2008, 2011 2013 and 2015, would you invest in Equity Funds if you knew!!!
What can you say about market direction in 2016? (Look at 2016 period which is on extreme right side)
- RSI - Well above 70 mark
- CCI - Well above 100 mark
- Look at the circles, can you spot any similarity
- PPO manages to remain above zero mark so far
- Market continues to near or above EMA(21)
Once RSI goes above 70 and CCI goes above 100, market continues to climb for next 3-8 months and then roll over. You can see this in above chart and it is consistent for last 15 years. However 2005 to 2008 is an exception as we were in MEGA BULL market but otherwise that has been the pattern.
Look at the horizontal line:
Every time market breakout to all time high, it came back to test the breakout level before continuing the move higher. However, this may not happen always in a MEGA BULL market scenario.
How will this analysis help us to invest for long term?
Typically, we invest in Mutual Funds OR Tax Saver Funds at the beginning of the year.
Look at above chart near beginning of 2000, 2008, 2011 2013 and 2015, would you invest in Equity Funds if you knew!!!
- RSI well below 70 mark
- CCI above 100 mark although moving down
- RSI touched 30 or came close and moving higher
- CCI touched -100 or came close and moving higher
Remember, nothing is guaranteed and market does what it wants. We are ONLY using historical data to understand market character and making assumptions to help us invest prudently.
"Past Performance Is No Guarantee Of Future Results."
Lets NOT forget below events:
Conclusions...NOW where would you invest your money in long term accounts for 2016!!!
As expected, Market peaked in 2015 and currently trying to find bottom. But will it be able to find it in next few weeks/months or continue to drag down!!! In long term view, market will go up but in near term next two months appear to be crucial.
Considering all the above, it appears to be a good time to start looking at equities at this time.
Which funds to select?
Mutual Funds
ELSS
Fund selection tools:
We hope this shall serve as a guide for you to make informed and intelligent investment decisions.
"Past Performance Is No Guarantee Of Future Results."
Lets NOT forget below events:
- Market is currently in a MEGA BULL market which we have experienced earlier during 2003-2007
- But MEGA BULL markets do experience quick draw downs which provide perfect opportunity for low risk entry
- Global economies, especially Euro-zone is still struggling and things may get worse due to refugee crisis
- US appears to be the most stable economy as $ is rising for past several months along with job growth
Conclusions...NOW where would you invest your money in long term accounts for 2016!!!
As expected, Market peaked in 2015 and currently trying to find bottom. But will it be able to find it in next few weeks/months or continue to drag down!!! In long term view, market will go up but in near term next two months appear to be crucial.
- BJP government is trying hard to establish credibility and it is not going well so far
- Policies take time to get into action at ground level
- Expectations mismatch results as disappointment in the market which we are already witnessing
- Also geo-political instability and worldwide slow growth will continue to affect
- Equilibrium shall soon be restored at which point markets will provide the next best entry
Considering all the above, it appears to be a good time to start looking at equities at this time.
Which funds to select?
Mutual Funds
- Look for best performing funds for past 1 year as the BULL market really started in last year
- Select funds with rating 4 and above (top 2 ratings by CRISIL or funds ranking)
- Now look for performance in last 1 / 3 / 5 years - select TOP 5 funds from each year and select common funds
- Also take a look at funds age, the older the fund the easier to find the chart and compare with market
- Be aware regarding fund fees and try to choose NO LOAD funds
- Invest in NOT more than 3 funds
ELSS
- Lock in period is 3 years hence you have to be cognizant about the fact that once the BULL run is over market can drop very quickly just the way it did in 2008. If you invested in ELSS equity fund in beginning of 2006 or 2007 then by end of 2008 what returns did you get!!!
- Look for best performing funds for past 1 year as the BULL market really started in last year
- Select funds with good rating
- Now look for performance in last 1 / 3 / 5 years - select TOP 5 funds from each year and select common funds
- Invest in NOT more than 3 funds
Fund selection tools:
We hope this shall serve as a guide for you to make informed and intelligent investment decisions.

 RSS Feed
