Beginning of every year we have following concerns:-
- Which Mutual Funds will out perform this year?
- Will this year be good for markets? AND Will it be better than last year?
- Which funds should we look at?
- Blah blah blah...
Let's see if we can identify following:
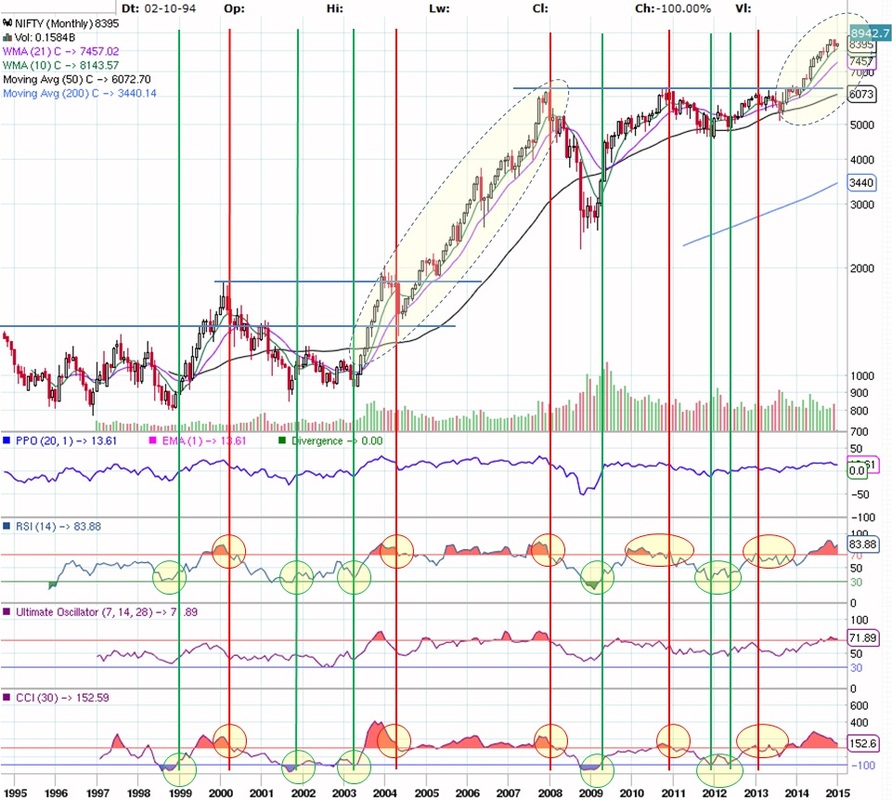
Take a look at below monthly Nifty chart.
Pay special attention to RSI & CCI. You don't need to worry about what each of those mean, just understand the chart action.
THIS IS VERY CONFUSING... well just observe the below chart carefully and soon you shall understand the relationship.
- Will this year be good or better for markets than last year?
- Are equities way to go or shall we consider debt funds!!!
- Is it wise to invest in Mutual Funds now? or is ETF a better option!!!
- Where to put our money to work for us?
Take a look at below monthly Nifty chart.
- Green lines - Suggests market is about to make a move higher
- Red lines - Suggests market is about to turnover and start moving down
Pay special attention to RSI & CCI. You don't need to worry about what each of those mean, just understand the chart action.
- CCI - Any time, it goes below -100 and moves back up, typically suggests that market will start moving higher. On the other hand, if it goes above 100 and moves back below that level, typically it means market will roll over and start going down.
- RSI - To be used in conjunction with CCI. Any time, it goes below 30 and moves back up, typically suggests that market will start moving higher. On the other hand, if it goes above 70 and moves back below that level, typically it means market will roll over and start going down.
THIS IS VERY CONFUSING... well just observe the below chart carefully and soon you shall understand the relationship.
Now that you got a chance to look at the above chart....
What can you say about market direction in 2015? (Look at 2015 period which is on extreme right side)
Once RSI goes above 70 and CCI goes above 100, market continues to climb for next 3-8 months and then roll over. You can see this in above chart and it is consistent for last 15 years. However 2005 to 2008 is an exception as we were in MEGA BULL market but otherwise that has been the pattern.
Look at the horizontal line:
Every time market breakout to all time high, it came back to test the breakout level before continuing the move higher.
How will this analysis help us to invest for long term?
Typically, we invest in Mutual Funds OR Tax Saver Funds at the beginning of the year.
Look at above chart near beginning of 2000, 2008, 2011 and 2013, would you invest in Equity Funds if you knew!!!
What can you say about market direction in 2015? (Look at 2015 period which is on extreme right side)
- RSI - Well above 70 mark
- CCI - Well above 100 mark
- Look at the dotted long circles, can you spot any similarity
Once RSI goes above 70 and CCI goes above 100, market continues to climb for next 3-8 months and then roll over. You can see this in above chart and it is consistent for last 15 years. However 2005 to 2008 is an exception as we were in MEGA BULL market but otherwise that has been the pattern.
Look at the horizontal line:
Every time market breakout to all time high, it came back to test the breakout level before continuing the move higher.
How will this analysis help us to invest for long term?
Typically, we invest in Mutual Funds OR Tax Saver Funds at the beginning of the year.
Look at above chart near beginning of 2000, 2008, 2011 and 2013, would you invest in Equity Funds if you knew!!!
- RSI well below 70 mark
- CCI above 100 mark although moving down
- RSI touched 30 or came close and moving higher
- CCI touched -100 or came close and moving higher
Remember, nothing is guaranteed and market does what it wants. We are ONLY using historical data to understand market character and making assumptions to help us invest prudently.
"Past Performance Is No Guarantee Of Future Results."
Lets NOT forget below events:
Conclusions...NOW where would you invest your money in long term accounts for 2015!!!
Now that market has established a strong bull trend and appears to be very similar to one that started in 2003-2008, we would expect the market to continue in that direction for another 2 years, however we do expect a scare drop in near future, BUT WHY?
Which funds to select?
Mutual Funds
ELSS
Fund selection tools:
We hope this shall serve as a guide for you to make informed and intelligent investment decisions.
"Past Performance Is No Guarantee Of Future Results."
Lets NOT forget below events:
- Market is currently in a MEGA BULL market which we have experienced earlier during 2003-2007
- But MEGA BULL markets do experience quick draw downs which provide perfect opportunity for low risk entry
- Global economies, especially Euro-zone is still NOT out of the woods
- US appears to be the most stable economy as $ is rising for past several months along with job growth
Conclusions...NOW where would you invest your money in long term accounts for 2015!!!
Now that market has established a strong bull trend and appears to be very similar to one that started in 2003-2008, we would expect the market to continue in that direction for another 2 years, however we do expect a scare drop in near future, BUT WHY?
- NEW BJP government is in place and markets made this significant leap based on all hype so far
- Very high expectations regarding change in policies/procedures/implementations
- Now that the honeymoon period (6 months) is over, everyone will return to reality soon
- Expectations will not be matched and soon we shall see the disappointment in the market
- Also geo-political events and global currents will continue to affect
- Equilibrium shall soon be restored at which point markets will provide the next best entry
Which funds to select?
Mutual Funds
- Look for best performing funds for past 1 year as the BULL market really started in last year
- Select funds with rating 4 and above (top 2 ratings by CRISIL or funds ranking)
- Now look for performance in last 1 / 3 / 5 years - select TOP 5 funds from each year and select common funds
- Also take a look at funds age, the older the fund the easier to find the chart and compare with market
- Be aware regarding fund fees and try to choose NO LOAD funds
- Invest in NOT more than 3 funds
ELSS
- Lock in period is 3 years hence you have to be cognizant about the fact that once the BULL run is over market can drop very quickly just the way it did in 2008. If you invested in ELSS equity fund in beginning of 2006 or 2007 then by end of 2008 what returns did you get!!!
- Look for best performing funds for past 1 year as the BULL market really started in last year
- Select funds with good rating
- Now look for performance in last 1 / 3 / 5 years - select TOP 5 funds from each year and select common funds
- Invest in NOT more than 3 funds
Fund selection tools:
We hope this shall serve as a guide for you to make informed and intelligent investment decisions.

 RSS Feed
