Beginning of every year we have following concerns:-
- Which Mutual Funds will out perform this year?
- Will this year be good for markets? OR Will it better than last year?
- Which ETF will out perform this year?
- Blah blah blah...
Let's see if we can identify following:
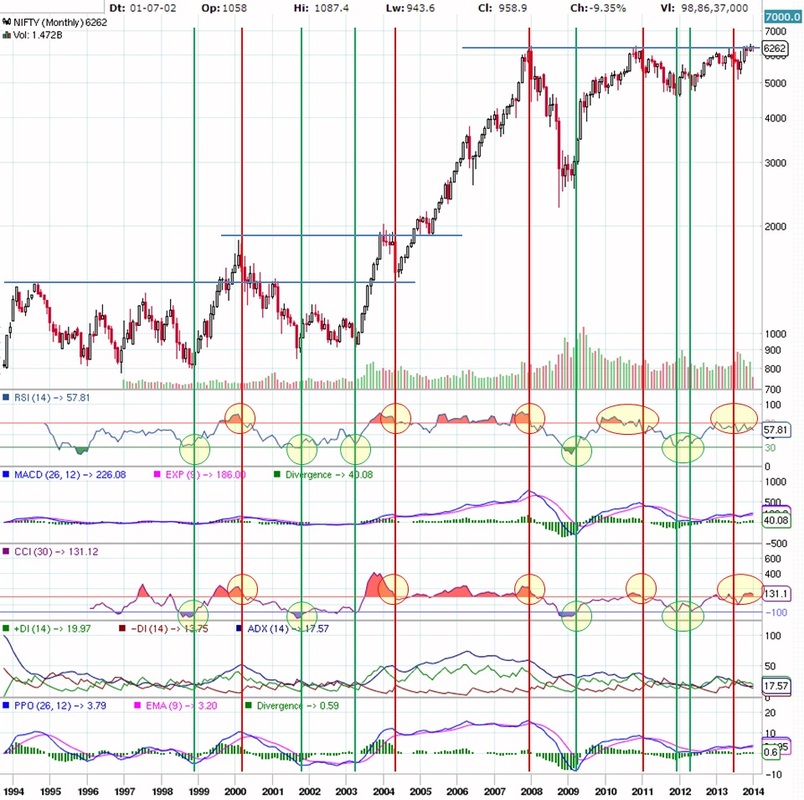
Take a look at below monthly Nifty chart.
Pay special attention to RSI, CCI, PPO. You don't need to worry about what each of those mean, just understand the chart action.
THIS IS VERY CONFUSING... well just observe the chart carefully and soon you shall understand the relationship.
- Will this year be good or better for markets than last year?
- Is it wise to invest in Mutual Funds now? or is ETF a better option!!!
- Where to put our money to work for us?
Take a look at below monthly Nifty chart.
- Green lines - Suggests market is about to make a move higher
- Red lines - Suggests market is about to turnover and start moving down
Pay special attention to RSI, CCI, PPO. You don't need to worry about what each of those mean, just understand the chart action.
- CCI - Any time, it goes below -100 and moves back up, typically suggests that market will start moving higher. On the other hand, if it goes above 100 and moves back below that level, typically it means market will roll over and start going down.
- RSI - To be used in conjunction with CCI. Any time, it goes below 30 and moves back up, typically suggests that market will start moving higher. On the other hand, if it goes above 70 and moves back below that level, typically it means market will roll over and start going down.
- PPO - To be used in conjunction with RSI & CCI.
- MACD & DI - To be used in conjunction with all above
THIS IS VERY CONFUSING... well just observe the chart carefully and soon you shall understand the relationship.
Now that you got a chance to look at the above chart....
What can you say about market direction in 2014? (Look at 2014 period which is extreme right side)
Once RSI goes above 70 and CCI goes above 100, market continues to climb for next 3-6 months and then roll over. You can see this in above chart and it is consistent for last 15 years. However 2005 to 2008 is an exception but otherwise that has been the pattern. However in current scenario, we seem to have some mixed signals.
Look at the horizontal line:
Every time market breakout to all time high, it came back to test the breakout level before continuing the move higher.
How will this analysis help us to invest for long term?
Typically, we invest in Mutual Funds OR Tax Saver Funds at the beginning of the year.
Look at above chart near beginning of 2000, 2008, 2011 and 2013, would you invest in Equity Funds if you knew!!!
Lets take a look at McClellan Index chart below:
What can you say about market direction in 2014? (Look at 2014 period which is extreme right side)
- RSI - Close to 70 mark but moving downwards after initially touching it earlier
- CCI - Already above 100 mark
- PPO - Recent cross over suggesting bullish action
- DI - Moving lower which is not good for markets
- MACD - Suggesting bullish action
Once RSI goes above 70 and CCI goes above 100, market continues to climb for next 3-6 months and then roll over. You can see this in above chart and it is consistent for last 15 years. However 2005 to 2008 is an exception but otherwise that has been the pattern. However in current scenario, we seem to have some mixed signals.
Look at the horizontal line:
Every time market breakout to all time high, it came back to test the breakout level before continuing the move higher.
How will this analysis help us to invest for long term?
Typically, we invest in Mutual Funds OR Tax Saver Funds at the beginning of the year.
Look at above chart near beginning of 2000, 2008, 2011 and 2013, would you invest in Equity Funds if you knew!!!
- RSI moving back below 70 mark & CCI moving back below 100 mark
- MACD & PPO cross-over and DI moving down
- RSI touched 30 or came close and moving higher
- CCI touched -100 or came close and moving higher
- MACD & PPO cross-over
Lets take a look at McClellan Index chart below:
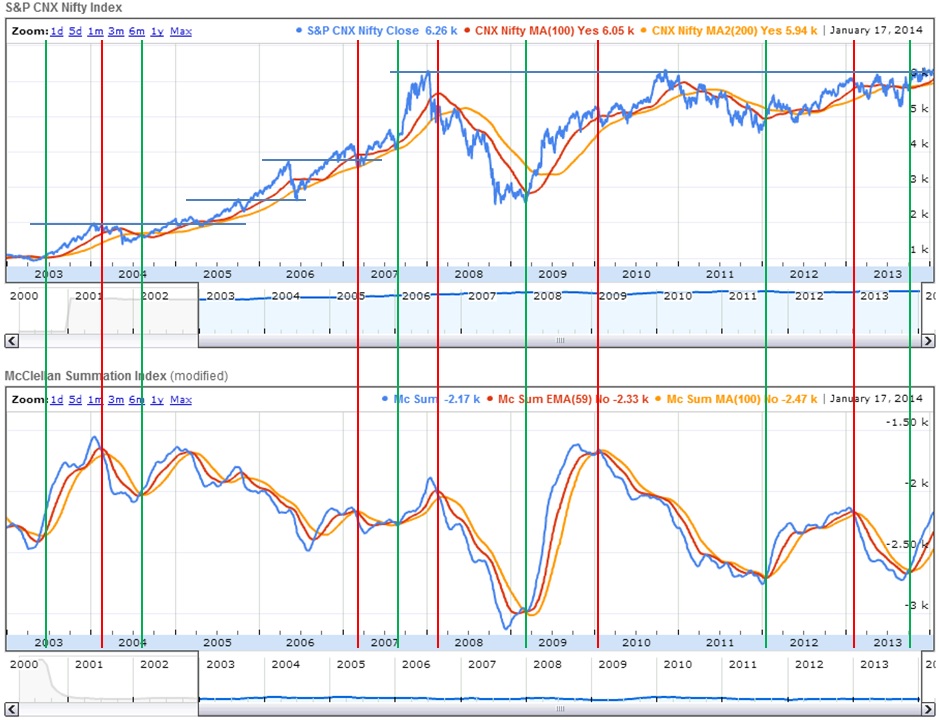
Green lines - Shows how market starts moving higher which is confirmed by McClellan Index line (blue line) moving higher
Red lines - Indicates change in direction by McClellan Index as well as market
Look at the horizontal line:
Every time market breakout to all time high, it came back to test the breakout level before continuing the move higher.
Another key piece of information to watch for -
As long as Market remains above MA(100), it is safe to remain invested in the market. Other times it is better to be on the sidelines.
What can you say about market direction in 2014? (Look at 2014 period which is extreme right side)
Any time McClellan Index is moving down, Market has either declined or gone sideways. The only exception is during 2004-2006 and 2010-2011.
Red lines - Indicates change in direction by McClellan Index as well as market
Look at the horizontal line:
Every time market breakout to all time high, it came back to test the breakout level before continuing the move higher.
Another key piece of information to watch for -
As long as Market remains above MA(100), it is safe to remain invested in the market. Other times it is better to be on the sidelines.
What can you say about market direction in 2014? (Look at 2014 period which is extreme right side)
- Market is well above MA(100) line
- McClellan Index is suggesting bullish action
Any time McClellan Index is moving down, Market has either declined or gone sideways. The only exception is during 2004-2006 and 2010-2011.
Remember, nothing is guaranteed and market does what it wants. We are ONLY using historical data to understand market character and making assumptions to help us invest prudently.
"Past Performance Is No Guarantee Of Future Results."
Lets NOT forget below events:
NOW where would you invest your money in long term accounts for 2014!!!
Considering we have some mixed signals, market appears to be on the verge of major directional change. If it does breakout then it will come back to test current levels hence we should NOT worry about missing massive BULL market. However if it does meltdown then it could get ugly. This suggests that neither Equity funds nor Debt funds appear to be a good choice for now. Instead, we might be better off parking our money in ETF's or liquid funds as we can exit anytime and DO NOT have restrictions. Also if you have to invest in mutual funds or ELSS funds then balanced funds would be better choice as of now.
You may also want to check out other articles here.
We hope this shall serve as a guide for you to make informed and intelligent investment decisions.
"Past Performance Is No Guarantee Of Future Results."
Lets NOT forget below events:
- Election results in next 3-4 months will significantly impact the markets
- Global economies, especially Euro-zone is still NOT out of the woods
- Many east European countries are under going massive civil unrest as well as some BIG conflicts are going on between China & Japan, N. Korean threats, etc
- US Fed has started tapering its quantitative easing (QE3) program
NOW where would you invest your money in long term accounts for 2014!!!
Considering we have some mixed signals, market appears to be on the verge of major directional change. If it does breakout then it will come back to test current levels hence we should NOT worry about missing massive BULL market. However if it does meltdown then it could get ugly. This suggests that neither Equity funds nor Debt funds appear to be a good choice for now. Instead, we might be better off parking our money in ETF's or liquid funds as we can exit anytime and DO NOT have restrictions. Also if you have to invest in mutual funds or ELSS funds then balanced funds would be better choice as of now.
You may also want to check out other articles here.
We hope this shall serve as a guide for you to make informed and intelligent investment decisions.

 RSS Feed
