Market is going sideways and has become choppy, currently holding above 50day MA. But will it hold above 50day MA? or Is there further downside!!! Can we find any clues?
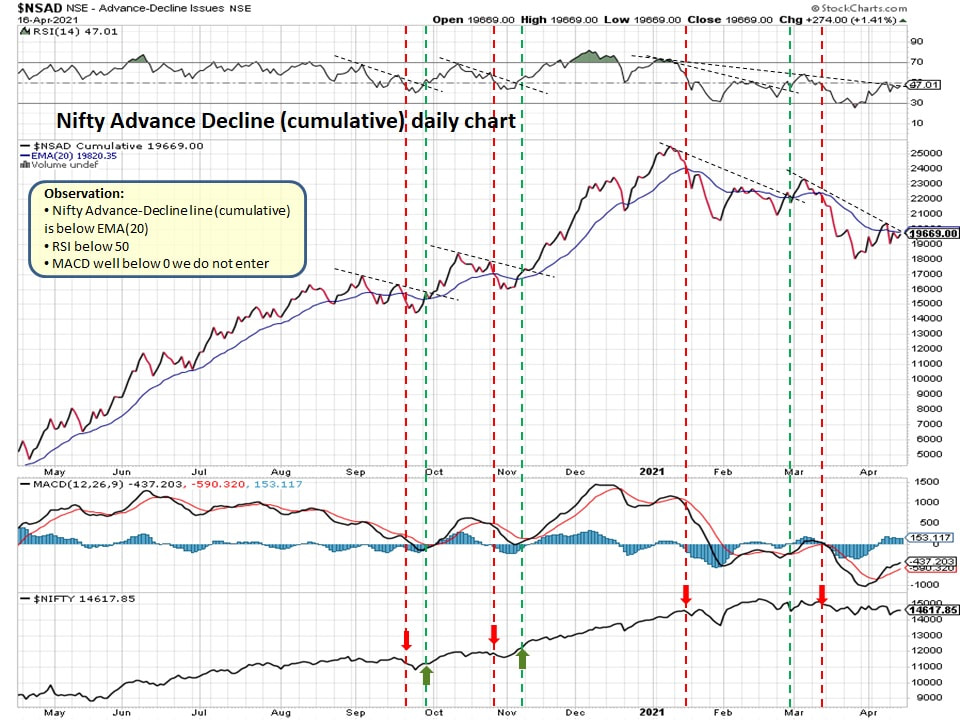
What is Nifty daily chart below telling us?
- Nifty has not gone anywhere in past 2 months
- RSI is below 50 mark
- MACD is below zero mark

What is Nifty AD cumulative line telling us?
- NSAD is below EMA(20) - Any time NSAD is below EMA(20), market has hard time to make any substantial gains and in most cases cannot sustain its current level
- Above characteristic can be seen by red and green arrows
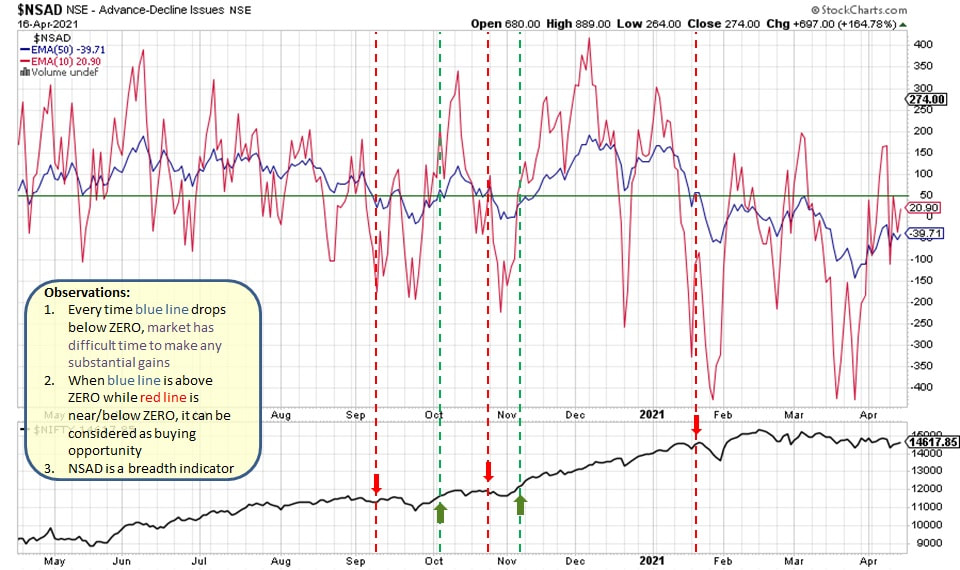
What is Nifty AD daily line telling us?
- Both NSAD 10day & 50day MA are below zero
- Until blue line gets above zero, we need to wait as market will not move higher until then
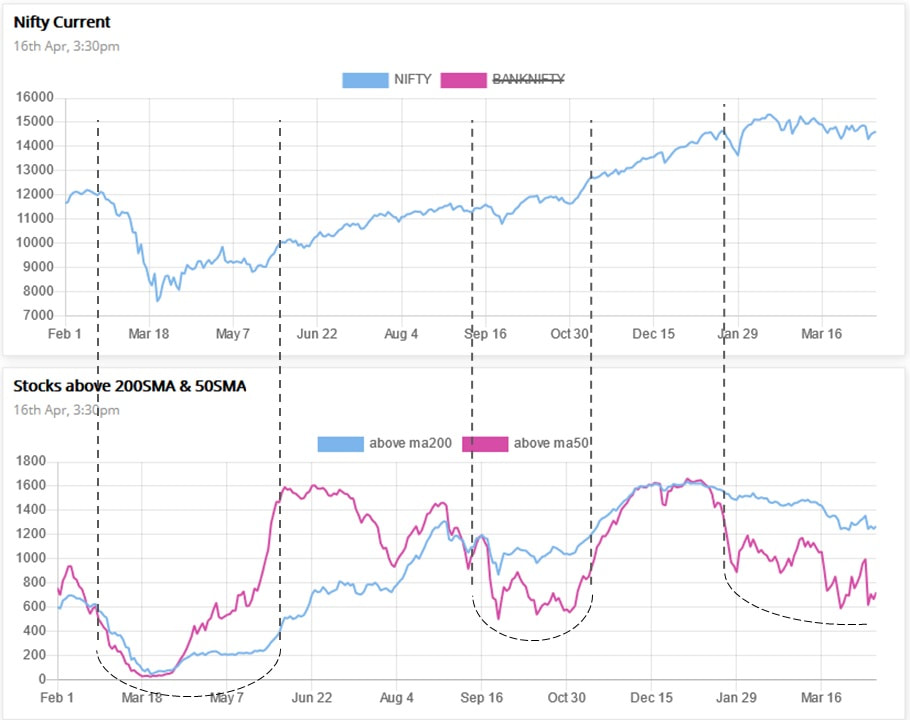
What is # of stocks above their 50day MA and # of stocks above their 200d MA telling us?
- Market cannot make any substantial gains if # of stocks above 50day MA and # of stocks above 200day MA are not rising
- Observe the dotted curve lines - once both purple and blue line starts moving higher then market takes off
Charts are always giving us clues, all we need to know is to look at right places.
Be prepared for further downside.
Good Luck!
- # of stocks above their 50day MA & # of stocks above their 200day MA is trending down suggesting it might take a while before market can move higher
- NIfty AD cumulative line is declining suggesting more stocks are declining than advancing, hence market may not be able to move higher
- It is very likely that Nifty might not be able to hold 50day MA
Be prepared for further downside.
Good Luck!

 RSS Feed
