Market is desperately trying to hold current levels in the middle of important global events. So far this year, market has managed to stay in a wide range (5400-6200) and could NOT break through the resistance. How much longer can this continue? What shall we expect in near term!!!
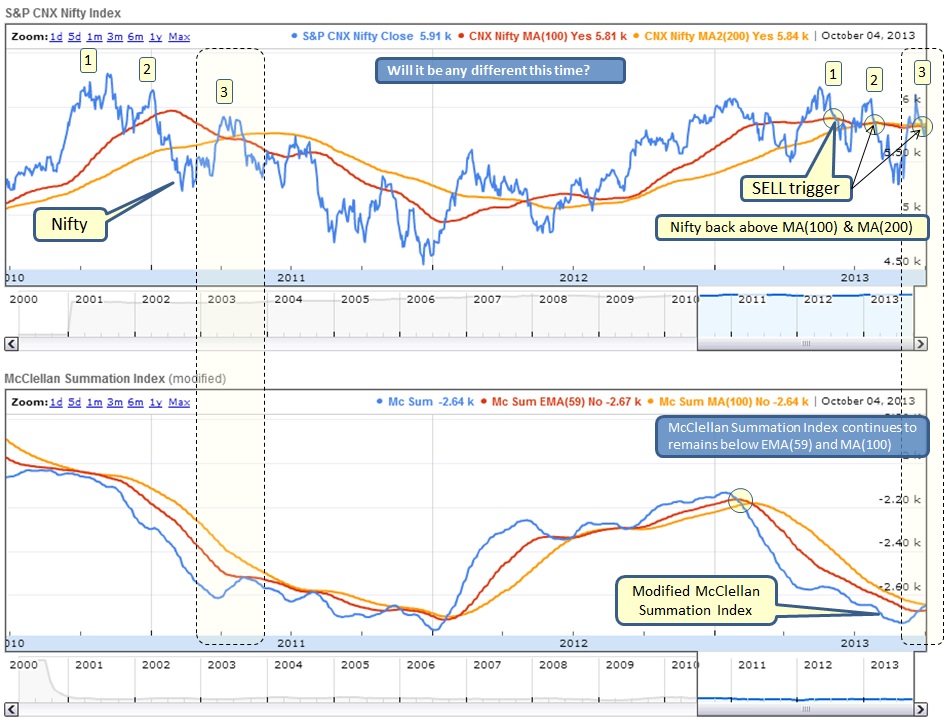
Market continues to exhibit similar pattern observed during late 2010-early 2011 before it rolled over. However this time it has managed to bounce back vigorously but could not penetrate resistance area. McClellan Index is showing signs of life which means more stocks are advancing than declining, however it will take months before we see any significant shift. For now, MA(200) is above MA(100) [can be seen on TOP portion of the chart] while Nifty sits right at MA(200).
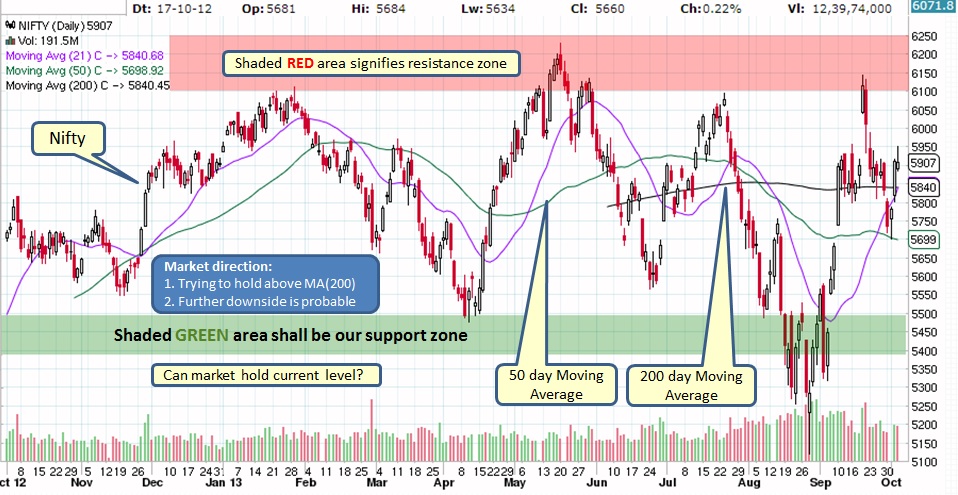
As can be seen from below chart, Nifty is fluctuation in a wide range from beginning of this year. It has tried to break through the resistance/support areas several times but was NOT successful.
Nothing has changed on weekly chart.
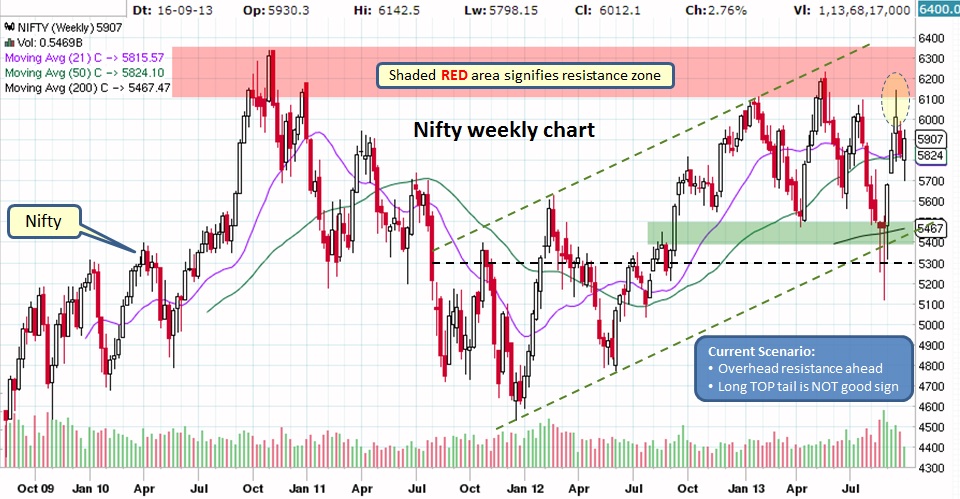
Market appears to be in a holding pattern, it needs significant catalyst to break through resistance/support areas. It seems like smart money is NOT yet ready to give up on this market and hence we keep getting too many conflicting signals. Probability of further downside is higher.
What does it mean for our Investments?
Market continues to remain vulnerable, hence be alert...
What does it mean for our Investments?
- Mutual Funds - It would be wise to stay in cash or invest in liquid funds or CDs. If you are still in equity markets then stay cautious and be prepared to take action if market continues to show weakness. If you are in debt funds than keep an eye on it and be prepared to act if it is not acting well.
- Stocks - ONLY invest in very convincing patterns and DO NOT forget STOP LIMIT in place.
Market continues to remain vulnerable, hence be alert...

 RSS Feed
