Beginning of every year :-
- Which Mutual Funds will out perform this year?
- Will this year be good for markets? OR Will it better than last year?
- Which ETF will out perform this year?
- Blah blah blah...
Let's see if we can identify following:
Take a look at below monthly Nifty chart.
Pay special attention to RSI, CCI, PPO. You don't need to worry about what each of those mean, just understand the chart action.
THIS IS VERY CONFUSING... well just observe the chart carefully and soon you will understand the relationship.
Green arrows display best time to remain invested in markets and Red arrows display market correction.
- Will this year be good or better for markets than last year?
- Is it wise to invest in Mutual Funds now? or is ETF a better option!!!
- What do we do?
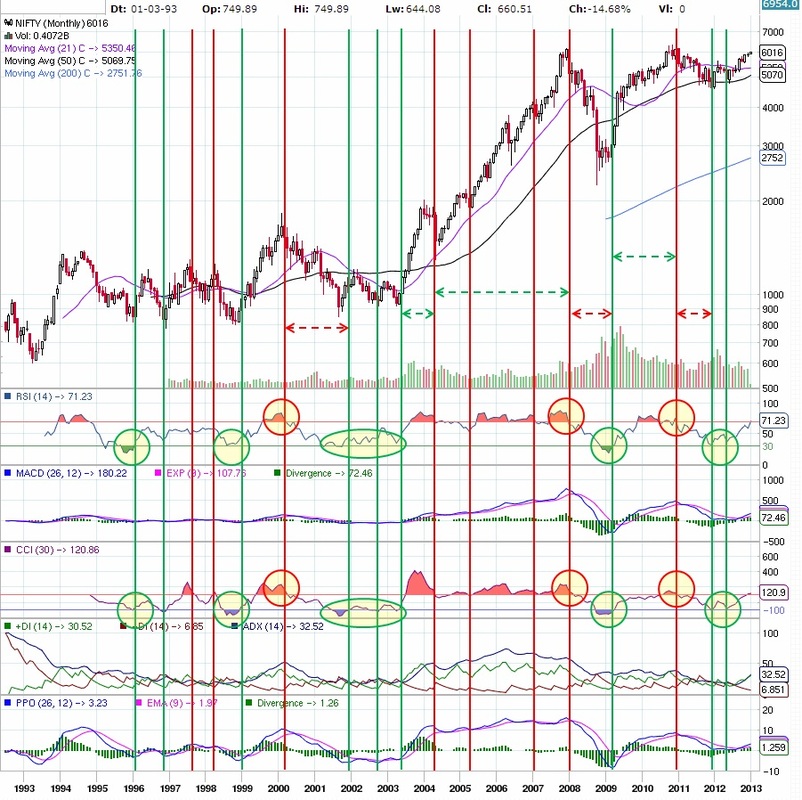
Take a look at below monthly Nifty chart.
- Green lines - Suggests market is about to make a move higher
- Red lines - Suggests market is about to turnover and start moving down
Pay special attention to RSI, CCI, PPO. You don't need to worry about what each of those mean, just understand the chart action.
- CCI - Any time, it goes below -100 and moves back up, typically suggests that market will start moving higher. On the other hand, if it goes above 100 and moves back below that level, typically it means market will roll over and start going down.
- RSI - To be used in conjunction with CCI. Any time, it goes below 30 and moves back up, typically suggests that market will start moving higher. On the other hand, if it goes above 70 and moves back below that level, typically it means market will roll over and start going down.
- PPO - To be used in conjunction with RSI & CCI.
- MACD & DI - To be used in conjunction with all above
THIS IS VERY CONFUSING... well just observe the chart carefully and soon you will understand the relationship.
Green arrows display best time to remain invested in markets and Red arrows display market correction.
Now that you got a chance to look at the chart and know what to look for....
What can you say about market direction in 2013? (Look at 2013 period which is extreme right side)
Once RSI goes above 70 and CCi goes above 100, market continues to climb for next 3-6 months and then roll over. You can see this in above chart and it is consistent for last 15 years. However 2005 to 2008 is an exception but otherwise that has been the pattern. Based on this historical pattern, it would be wise to assume that market will continue to remain bullish in 1st half of 2013 after which we might see market rollover.
Remember, nothing is guaranteed and market does what it wants. We are ONLY using historical data to understand market character and making assumptions to help us invest prudently.
How will this analysis help us to invest for long term?
Typically, we invest in Mutual Funds OR Tax Saver Funds at the beginning of the year.
Look at above chart near beginning of 2008 and 2011, would you invest in Equity Funds if you knew!!!
Now look at 2013, where would you invest your money in long term accounts!!!
Considering the fact that market may be good for 1st half but might experience trouble in 2nd half, neither Equity funds nor Debt funds appear to be a good choice for now. Instead, we might be better off parking our money in ETF's as we can exit anytime and DO NOT have restrictions.
We hope this shall serve as a guide for you to make informed and intelligent investment decisions.
What can you say about market direction in 2013? (Look at 2013 period which is extreme right side)
- RSI - Already above 70 mark
- CCI - Already above 100 mark
- PPO - Recent cross over suggesting bullish action
- DI - Moving higher which is good for markets
- MACD - Recent cross over suggesting bullish action
Once RSI goes above 70 and CCi goes above 100, market continues to climb for next 3-6 months and then roll over. You can see this in above chart and it is consistent for last 15 years. However 2005 to 2008 is an exception but otherwise that has been the pattern. Based on this historical pattern, it would be wise to assume that market will continue to remain bullish in 1st half of 2013 after which we might see market rollover.
Remember, nothing is guaranteed and market does what it wants. We are ONLY using historical data to understand market character and making assumptions to help us invest prudently.
How will this analysis help us to invest for long term?
Typically, we invest in Mutual Funds OR Tax Saver Funds at the beginning of the year.
Look at above chart near beginning of 2008 and 2011, would you invest in Equity Funds if you knew!!!
- RSI moving back below 70 mark & CCI moving back below 100 mark
- MACD & PPO cross-over and DI moving down
- RSI touched 30 or came close and moving higher
- CCI touched -100 or came close and moving higher
- MACD & PPO cross-over
Now look at 2013, where would you invest your money in long term accounts!!!
Considering the fact that market may be good for 1st half but might experience trouble in 2nd half, neither Equity funds nor Debt funds appear to be a good choice for now. Instead, we might be better off parking our money in ETF's as we can exit anytime and DO NOT have restrictions.
We hope this shall serve as a guide for you to make informed and intelligent investment decisions.

 RSS Feed
