Market continues to remain in resistance zone and near recent HIGHs. How far will this continue to play out? Is this right time to get in the market? OR should we wait n watch!!! What should we do?
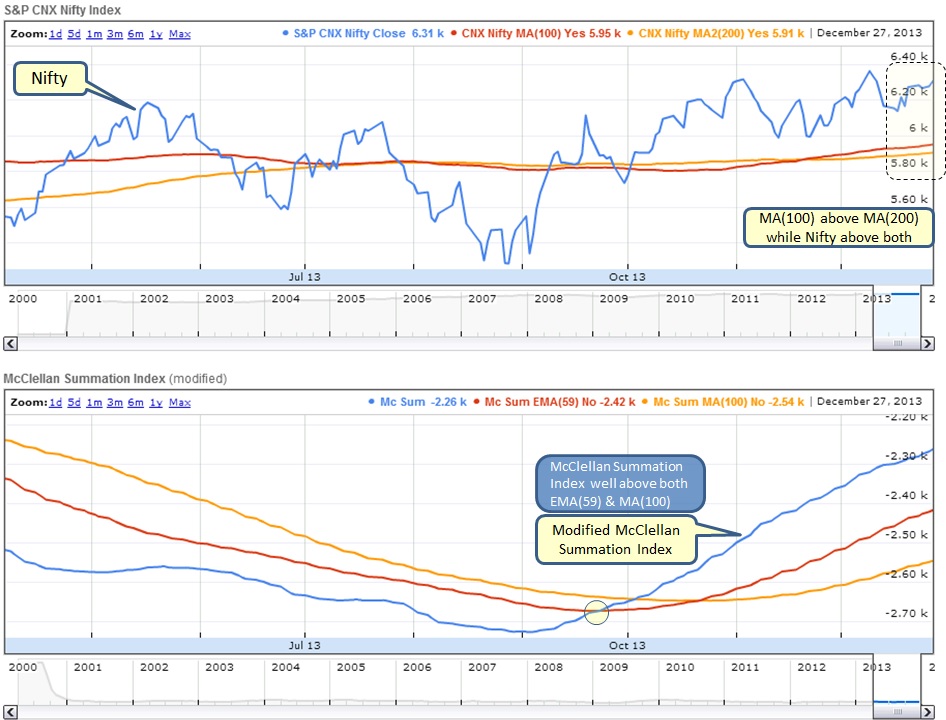
What is below chart telling us?
- Upper chart - Nifty remains well above MA(100) & MA(200) while MA(100) continues to remain above MA(200), both suggest bullish action for now.
- Lower chart - McClellan Index rising higher and remains well above EMA(59) & MA(100) suggesting more and more stocks are advancing than declining and hence supports bullish action for now.
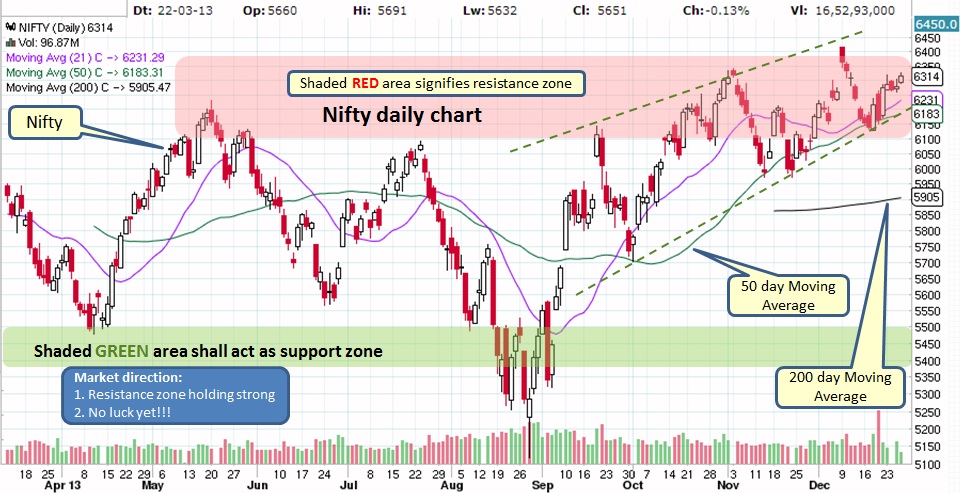
Nifty's struggle continues to remain in the resistance area as can be seen from chart below. We need a significant surge higher to break through the resistance area.
Not much changed on Weekly Nifty chart below.
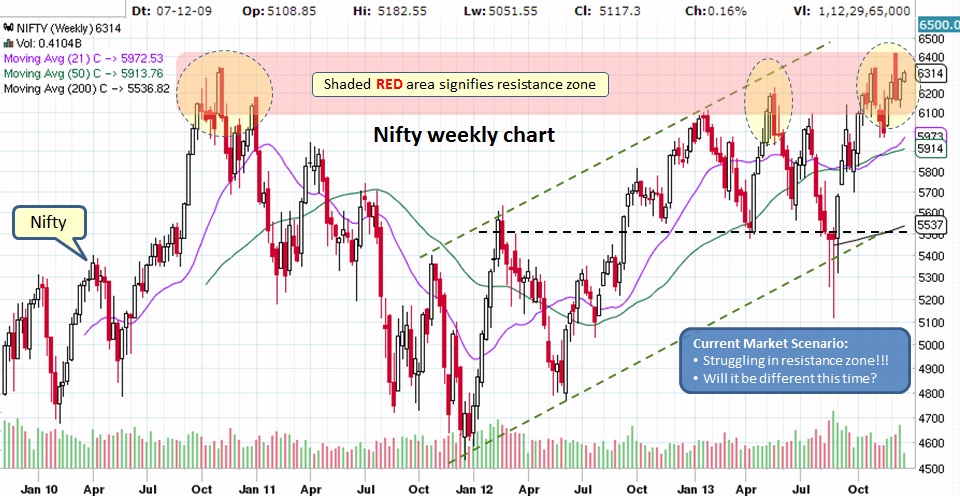
We have been talking about this resistance for weeks/months now:
What does it mean for our Investments?
Market going sideways yet bullish for now...
- We need some significant news to break through the resistance area
- 2014 Election results will play a BIG role in market direction but the results will be out in couple of months, we are already witnessing DELHI elections turmoil, now imagine similar things happening at National level
- Global economic news can have significant impact on the markets as well
What does it mean for our Investments?
- Mutual Funds - If invested in equity funds then stay put but be ready to pull the plug if market falls below 6000 level. If invested in debt/bond funds then DO NOT take a loss more than 8-10%, until then let it ride. It might be in our best interest to stay in FDs or Liquid Funds for now.
- Stocks - ONLY invest in strong patterns and DO NOT forget to have STOP LIMIT in place. This week we added NEW candidates to our Watch list which is listed here.
Market going sideways yet bullish for now...

 RSS Feed
