Market continues to remain in pullback mode and trying to find support, however global markets are weak causing the drag. Where are the probable support zones!!! Can this pullback turn into a correction!!! What can we expect?
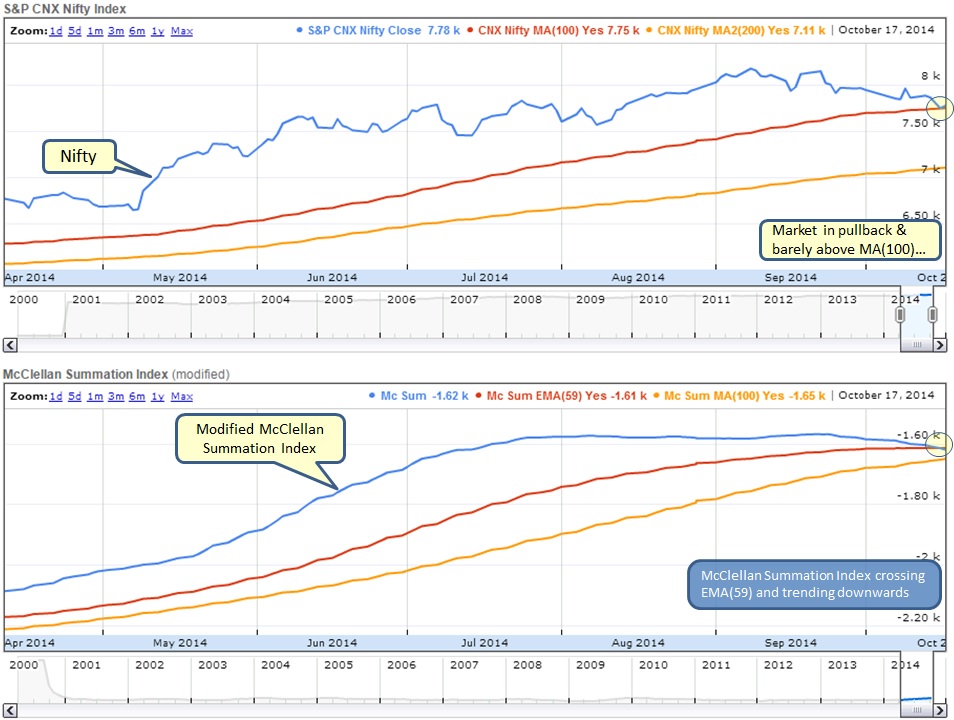
What is below chart telling us?
- Nifty barely above MA(100) while MA(100) well above MA(200) - Any time market drops below MA(100), it is a warning sign and we should exercise more caution
- McClellan Index has crossed EMA(59) and is trending downwards - suggesting to be careful
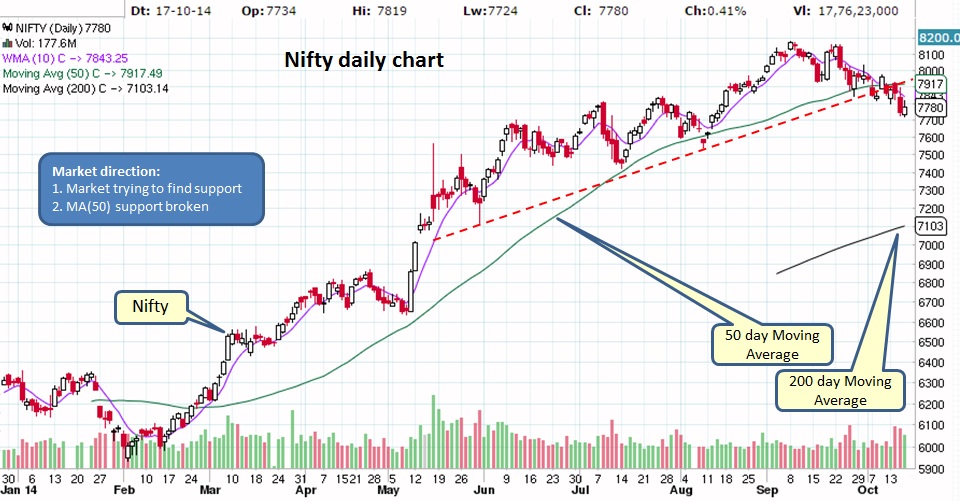
Nifty could NOT hold onto MA(50) support and has also broken the dotted trend line (shown in red). Market may attempt to bounce but now MA(50) will act as resistance unless market decisively breaks through it. Also note the red bars at the bottom of the chart displaying daily volume suggesting more distribution days in recent times.
Market pullback is very evident in below weekly chart but so far we have had only approx 5% pullback which is normal for a BULL market. Next support is near 7400-7600 area.
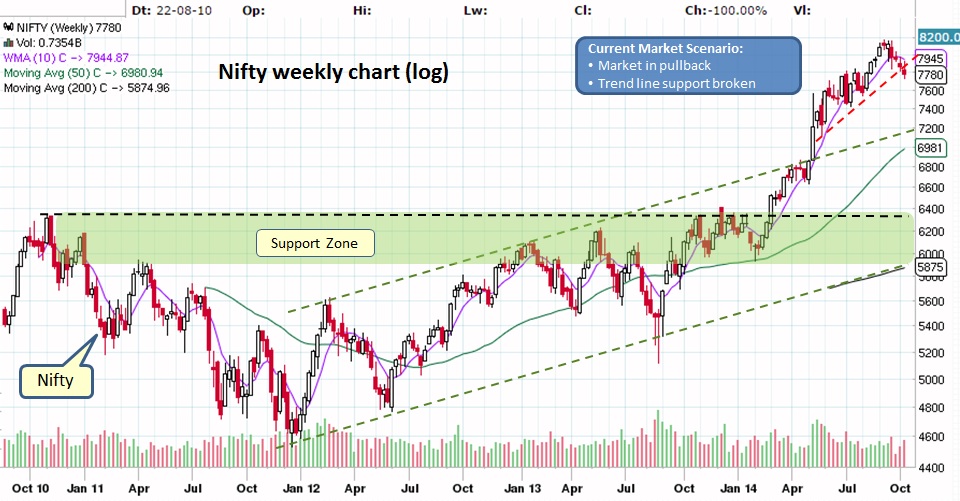
As mentioned earlier, so far market is experiencing orderly pullback. Now whether this pullback converts into a correction remains to be seen. We might be experiencing the early signs of MEGA BULL market which we call as a "SHOCK" and has potential to take down the market to 7200 area scaring everyone. BUT lets not get ahead of us, one step at a time.
What does it mean for our Investments?
Market remains in pullback mode hence its better to be cautious...
What does it mean for our Investments?
- Mutual Funds - Stay invested in equities if already in the market and NO need to stop SIP. If in cash/liquid funds/FDs then have patience and wait for next low risk entry.
- Stocks - ONLY invest in good patterns and do not forget to have STOP LIMIT in place. It is very hard to find good setups in these markets so be careful. Use our trade size calculator to manage your risk and also check our watch list which might help you identify good candidates.
Market remains in pullback mode hence its better to be cautious...

 RSS Feed
