Lets look at a powerful technique which can yield strong gains in relatively short time. All you need is to visually identify a simple pattern and wait for breakout or breakdown as this technique works both ways.
We are going to look at few weekly charts to identify a very simple pattern known as "consolidation break" or "range bound break" action.
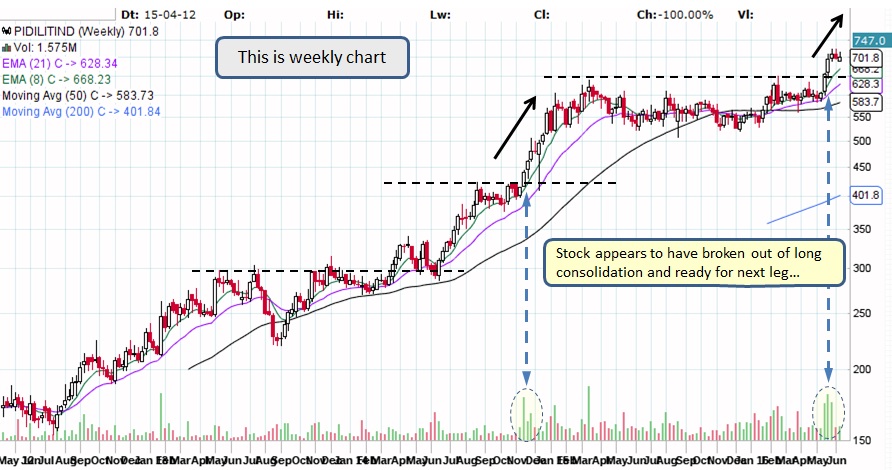
Take a look at below weekly chart and make quick observations:
Take a look at below weekly chart and make quick observations:
- Stock appeared to be consolidating for past several weeks/months before recent breakout
- After recent breakout it appears to be consolidating again for last few weeks
- Breakout happens on a relatively high volume (shown by dotted circles at bottom)
- Immediately after breakout, stock appears to move fast and make some quick gains (10-50%)
Now take a look at below weekly charts.
This is a very simple and powerful pattern, anytime a stock undergoes consolidation for several weeks/months it builds up enough energy for the next move. Typically the next move is in the direction of the trend and happens fast once the consolidation zone is broken especially on HIGH volume.
Why weekly chart?
Weekly chart is not too long term nor too short term and provides an ideal scenario to spot such a pattern, also provides us enough time to be prepared for such a move ahead of time.
Is HIGH volume necessary?
Higher volume suggest that the move is real and most likely to continue in the direction of the trend, however it is not absolute necessary. Volume helps to confirm the move in the direction of trend.
How do we go about finding such candidates?
Scan for stocks whose yearly performance is more than 100% which means they have gained 100% in a year along with decent average volume.
Use any scanning tool such as
Things to remember:
We hope this helps you to find your next potential candidates.
Good luck!
Why weekly chart?
Weekly chart is not too long term nor too short term and provides an ideal scenario to spot such a pattern, also provides us enough time to be prepared for such a move ahead of time.
Is HIGH volume necessary?
Higher volume suggest that the move is real and most likely to continue in the direction of the trend, however it is not absolute necessary. Volume helps to confirm the move in the direction of trend.
How do we go about finding such candidates?
Scan for stocks whose yearly performance is more than 100% which means they have gained 100% in a year along with decent average volume.
Use any scanning tool such as
- JStock - Free stock market software, provides stock scanner
- Screener.in - Stock screener for Indian Stocks
Things to remember:
- Always remember to have an entry and exit strategy, any losses should be contained at all cost.
- Any technique works only if market supports it, hence understanding market direction is absolute necessary.
- Keep an eye on earnings date or upcoming news.
We hope this helps you to find your next potential candidates.
Good luck!

 RSS Feed
