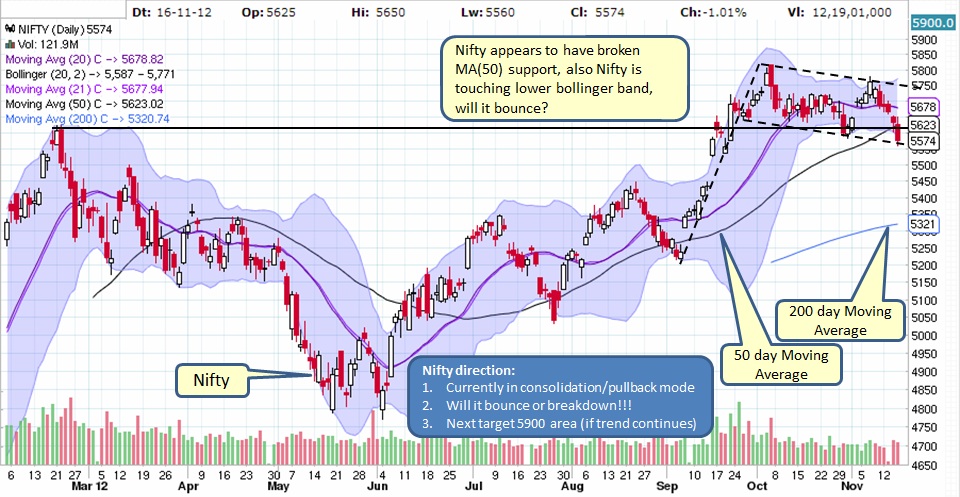
Market is in pullback mode and moving in a narrow downward channel from mid-Oct. On Friday, market closed below MA(50) which is considered bearish in short term. But how far market will continue its journey on this path or will it bounce hard. What to expect next!!!
What is below chart telling us?
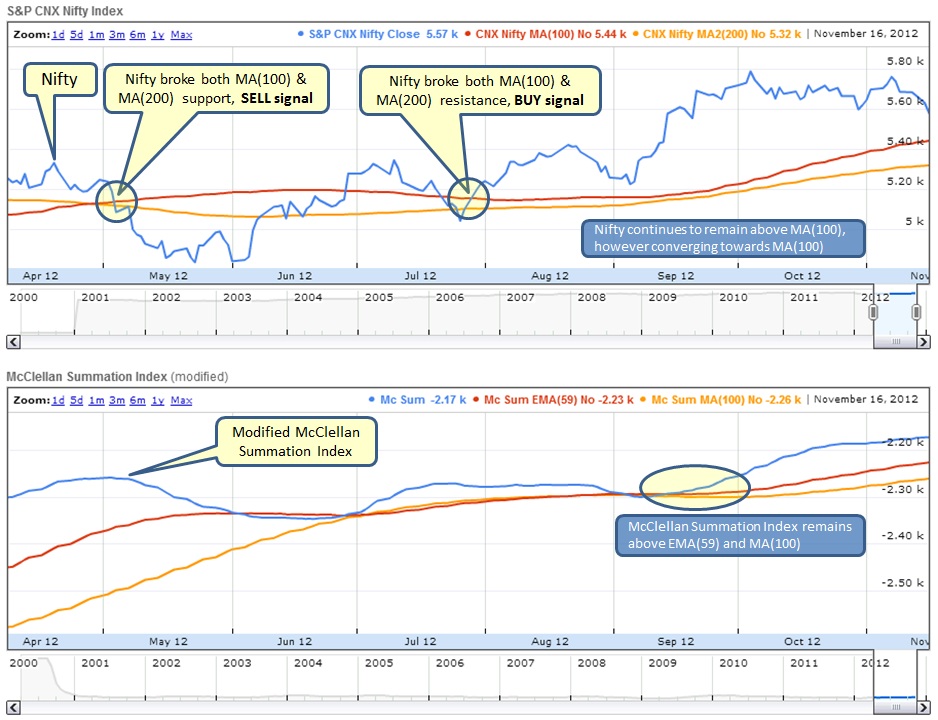
- Nifty remains above MA(100), however Nifty is converging rapidly towards MA(100) and drop below it will be a sign of concern for long term investment
- McClellan Index is well above EMA(59) and no signs of worry as of now
The narrow downward channel is clearly visible below and as mentioned in last weeks post appears to be a BULL FLAG, however market broke MA(50) support which is considered bearish in short term. If we see immediate bounce above MA(50) then market may continue to remain in this narrow range and might break the bull flag to upside. BUT if it continues to breakdown further than expect market to drop further near 5400 area.
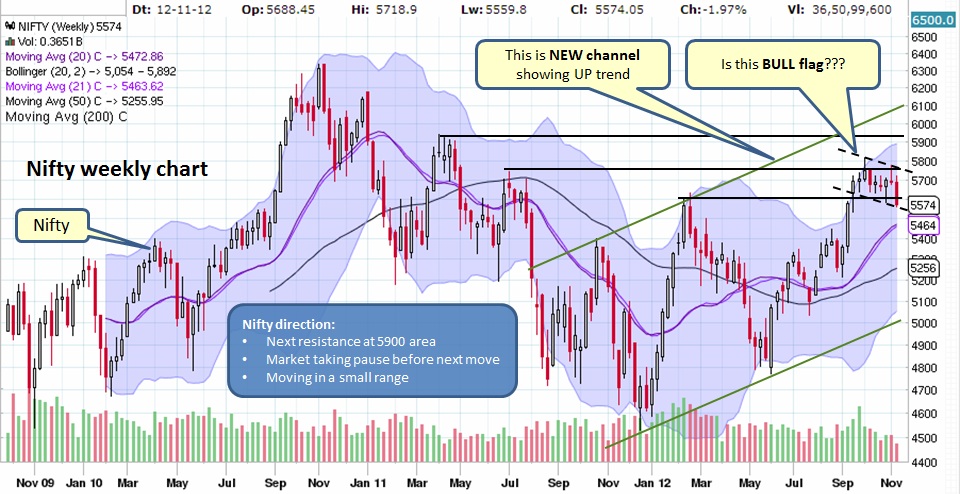
On weekly chart , it is clearly visible that this pullback so far appears to be controlled and is normal character of a bull move. The key thing to look is if market drops further then it breaks down out of BULL FLAG and may find support near 5450 area. A bounce at current level is needed to remain inside BULL FLAG.
What does this mean for our long term investments?
Stay alert and be cautious...
- Mutual Funds - No signs of concern yet for long term, hence stay invested
- Stocks - Market in pullback mode, which means many stocks may breakdown and a good risk management needs to be in place, hence have STOP LIMIT in place
Stay alert and be cautious...

 RSS Feed
