So far in last few weeks, market has managed to stay in a narrow range without breaking down. But if you look closer you may identify a pattern, which might provide some clues regarding market behavior in coming weeks ahead. What do we foresee?
Nothing new here, we do not see any concern for now as:
- McClellan Index is above EMA(59)
- Nifty is well above MA(100) and MA(200)

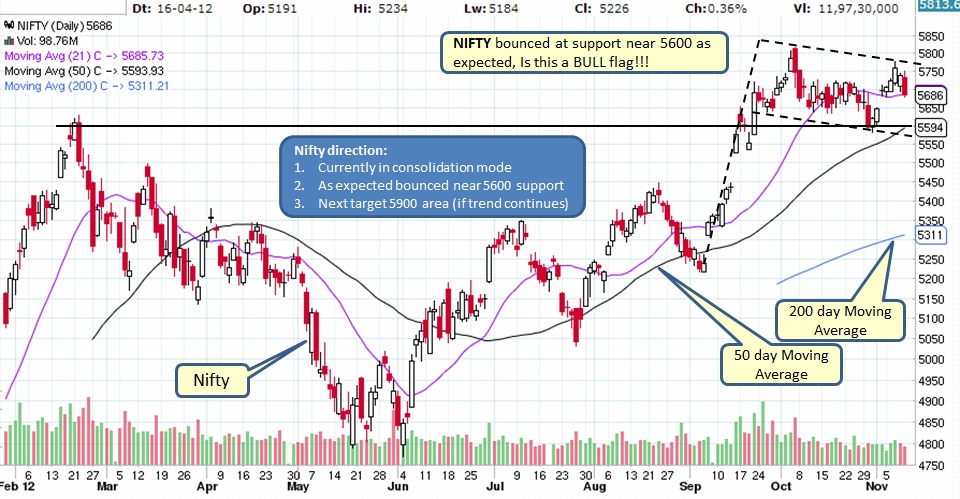
Check out the dotted lines in below daily Nifty chart. Does it look like a flag? Also know as "BULL FLAG" and is considered bullish pattern. Another thing to observe, check MA(50) is rising and catching up with the price, we might soon see market bounce of MA(50) and break the flag soon to reach 5900 area. However, if at all it breaks the flag to downside which would also mean it breaks MA(50) support then next support is at 5300-5400 area.
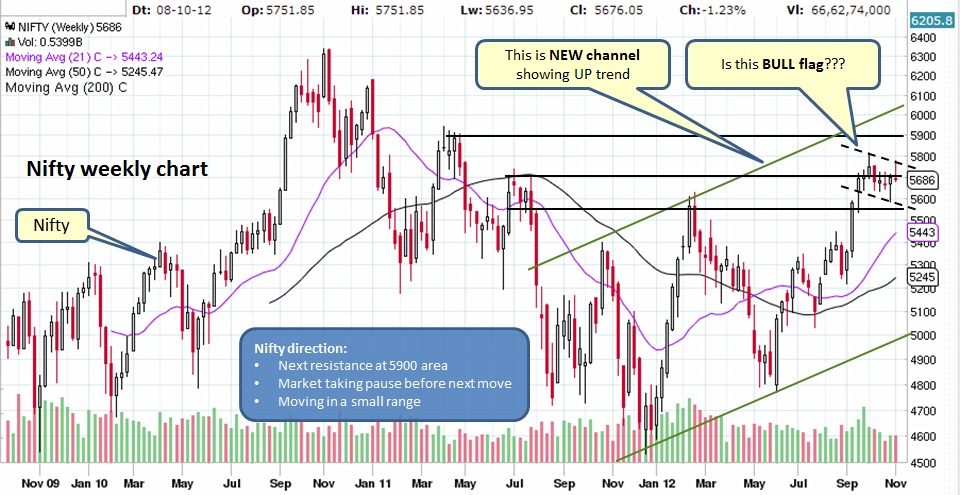
Market has been in pullback mode for couple of weeks which can be easily seen in below weekly chart. As long as market does not breakdown, this consolidation can be considered healthy for the next leg up.
What does it mean for our Investments?
Stay focused and be alert...
- Mutual Funds - Stay invested as we do not see any signs of concern so far.
- Stocks - Since market appears to be in pullback mode, stay cautious and individual stocks can breakdown easily. make sure you have STOP LIMIT in place and invest in good patterns.
Stay focused and be alert...

 RSS Feed
