Market had a nice bounce last week but should we consider this as end of correction!!! Euro-zone issues are not yet resolved and Greece elections are within next 10 days. Expect zig-zag action as long as market remains below MA(100). How long this volatility continue before we see a decisive market direction?
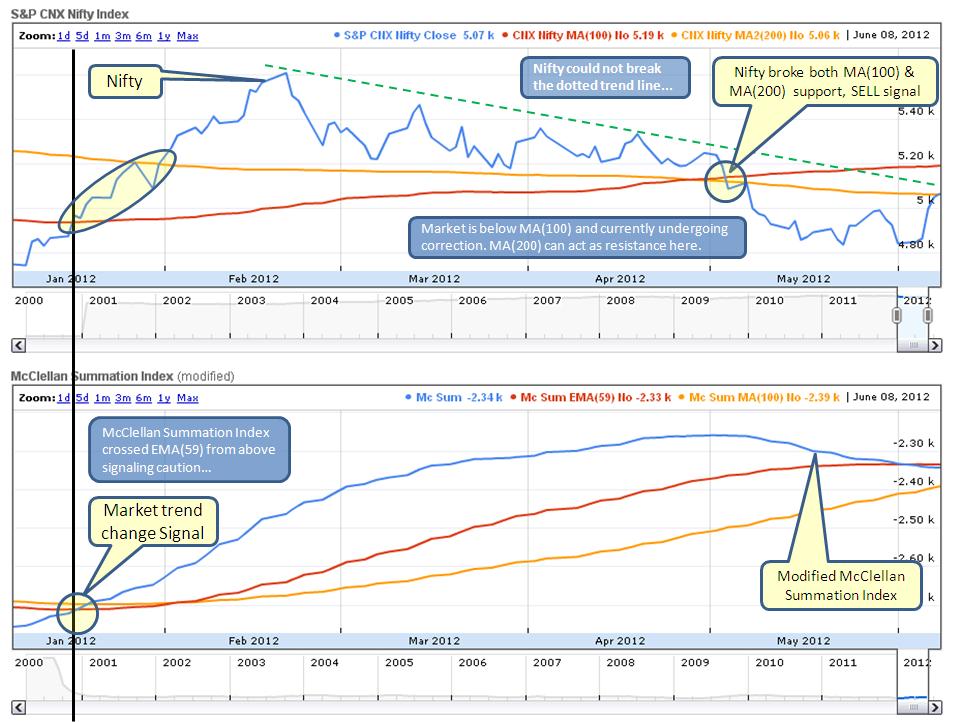
From below chart, top section it is clear that market is below its MA(100) line and MA(200) line. MA(200) line could act as resistance here, also note how the dotted trend line could act as resistance here. The bottom section of the chart shows McClellan Index crosses EMA(59) from above signalling caution.
Since both below conditions are TRUE, we stay out of market:
Since both below conditions are TRUE, we stay out of market:
- Market is below its MA(100)
- McClellan index crossed EMA(59) from above
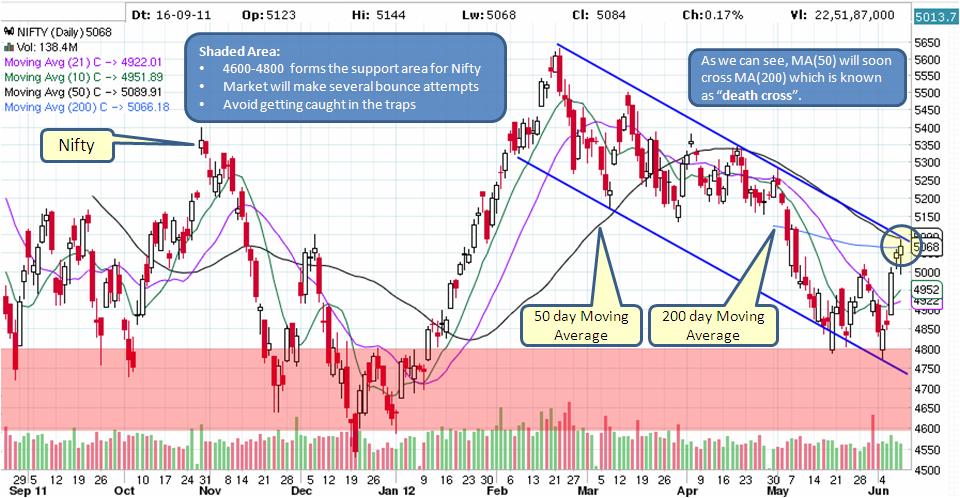
Below daily NIFTY chart shows the downtrend channel, we are at the top range and could see a retrace back into the channel.
Also, it can be seen that MA(50) will be crossing MA(200) from above which is NOT a good sign and often known as "death cross". The shaded red area in the chart signifies support area. Expect many bounces here before market entering a established trend.
Also, it can be seen that MA(50) will be crossing MA(200) from above which is NOT a good sign and often known as "death cross". The shaded red area in the chart signifies support area. Expect many bounces here before market entering a established trend.
For now be cautious and DO NOT fall into trap. However, use this time to build your stock watch list for potential BUY candidates.
Good Luck!!!
Good Luck!!!

 RSS Feed
