So far, this month has been good for the market. Now that resistance is broken most likely we shall see market rise further. But for how long and how far!!!
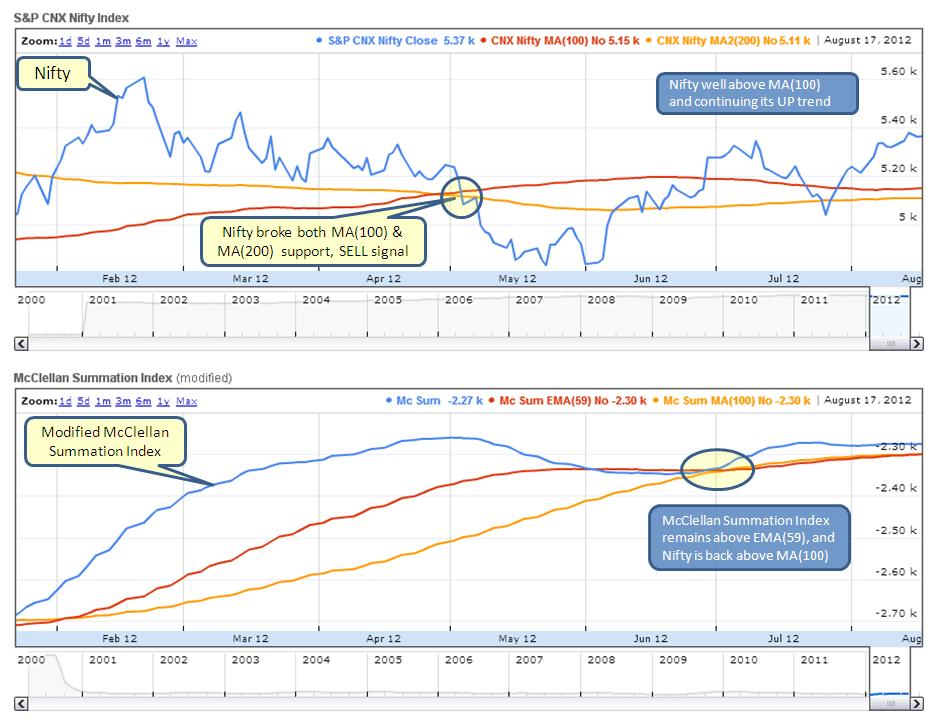
Below chart shows two things which signifies market in UP trend:
- Nifty above MA(100)
- McClellan Index above EMA(59)
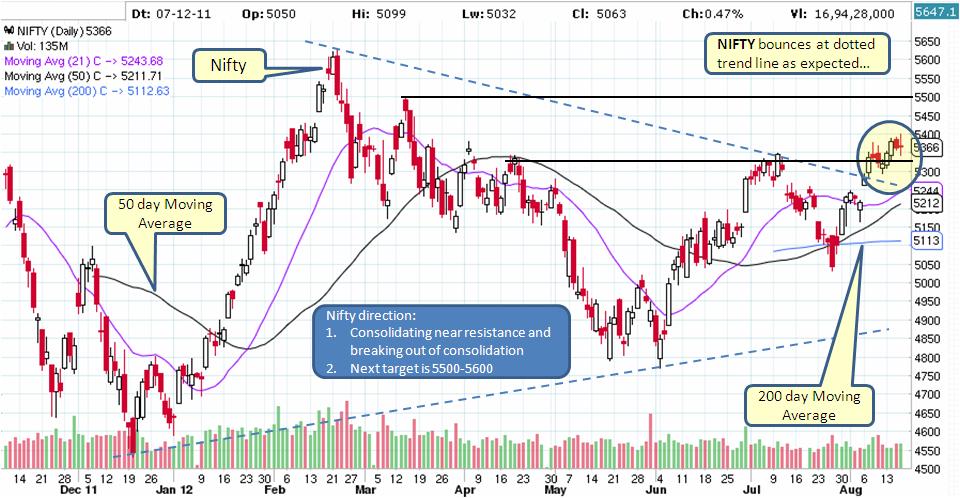
Below daily Nifty chart clearly shows the broken resistance. In coming days, we shall see market rise further to 5500-5600 area where it may consolidate again or might see a pullback.
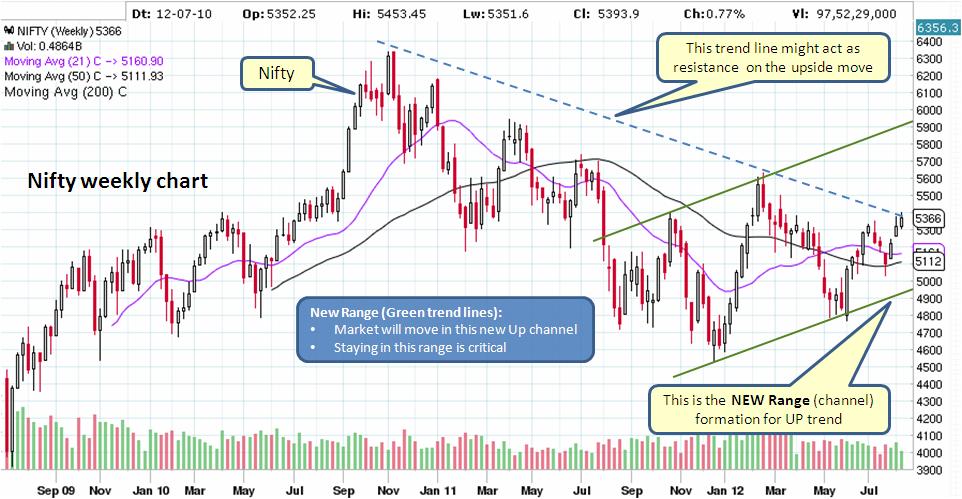
Weekly Nifty chart displays another resistance with dotted line. Will it hold or will market break it!!! We will find out next week but considering current momentum, odds of winning are on UP side.
How long will this UP trend continue?
What about our Investments!!!
Mutual Funds: Stay invested as all signs for now are showing strength in the UP trend, until we see signs of trouble we don't touch these accounts.
Stocks: Choose right stocks with good patterns & potential growth along with appropriate STOP LIMIT.
Enjoy the party till it lasts...
- Euro-zone debt issues remain contained, NO bad news out of Euro-zone
- BRIC countries do not show signs of significant slow down
- Indian politics does not loose foreign investor confidence any further with their loose policies
What about our Investments!!!
Mutual Funds: Stay invested as all signs for now are showing strength in the UP trend, until we see signs of trouble we don't touch these accounts.
Stocks: Choose right stocks with good patterns & potential growth along with appropriate STOP LIMIT.
Enjoy the party till it lasts...

 RSS Feed
