Two weeks back, market broke out of consolidation area with good volume. Last week, market went in pullback mode and now close to testing the support area formed by earlier consolidation.
How do we know this!!! and how long will this trend last!!!
How do we know this!!! and how long will this trend last!!!
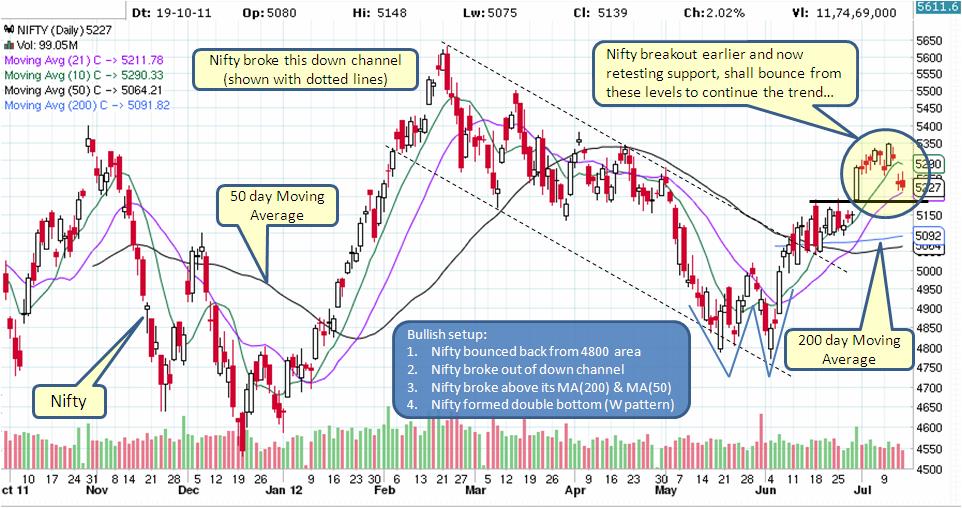
Below chart shows us, when we got our BUY signal...

Check the area enclosed by circle in below daily Nifty chart. Most likely market should bounce of these levels and continue the trend upwards. However, if Nifty does not hold the support (shown by bold black line) then the BULL trend will be in jeopardy.
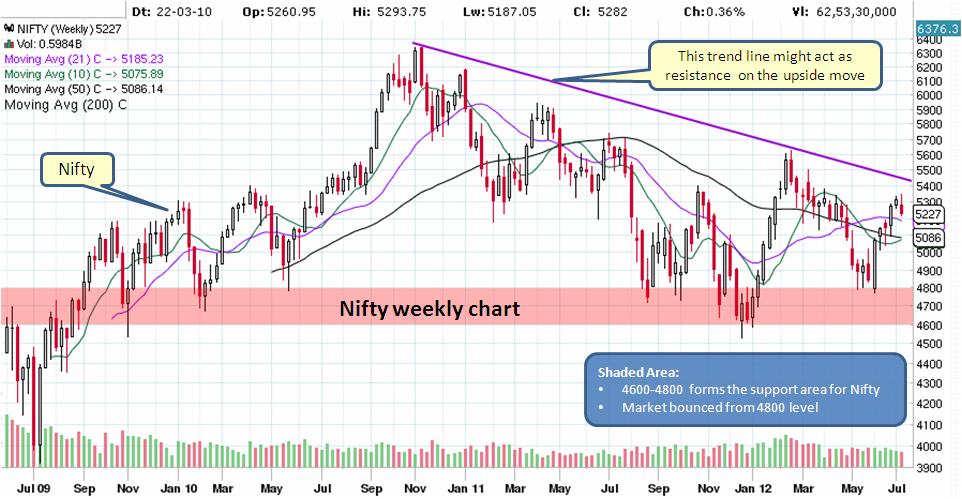
Weekly Nifty chart below provides a bigger picture. If the trend continues higher then expect a resistance near 5400 area and break of that level could take Nifty to 5600 area or even to 5900 area before pullback.
Although all above charts might suggest that BULL trend shall be continuing for now, DO NOT forget that Euro-zone issues are NOT yet resolved and any bad news could send shocks across the global markets. However, our charts will guide us accordingly till then enjoy the party...
Stay focused and be alert!
Stay focused and be alert!

 RSS Feed
