What just happened? Sensex was down by 320 points on Friday which tells us something major happened.
So what did really happen?
It was the item 1 above which pulled the market down significantly. This shows how much Indian markets are dependent on FIIs and a global financial crisis can bring Indian markets to its knees, hence it is very important to be aware of Global economies along with our national economy.
For now the BIG question will be "Is the UP trend over!!!"
So what did really happen?
- Fear of Mauritius tax treaty (which is under review) - This treaty allows Foreign Institutional Investors route their funds into India and take tax benefits but since government may revoke this tax treaty which means the FIIs will be limited to invest in India due to tax consequences
- Weak economic data from US & Europe
- Depreciation of rupee against dollar
It was the item 1 above which pulled the market down significantly. This shows how much Indian markets are dependent on FIIs and a global financial crisis can bring Indian markets to its knees, hence it is very important to be aware of Global economies along with our national economy.
For now the BIG question will be "Is the UP trend over!!!"
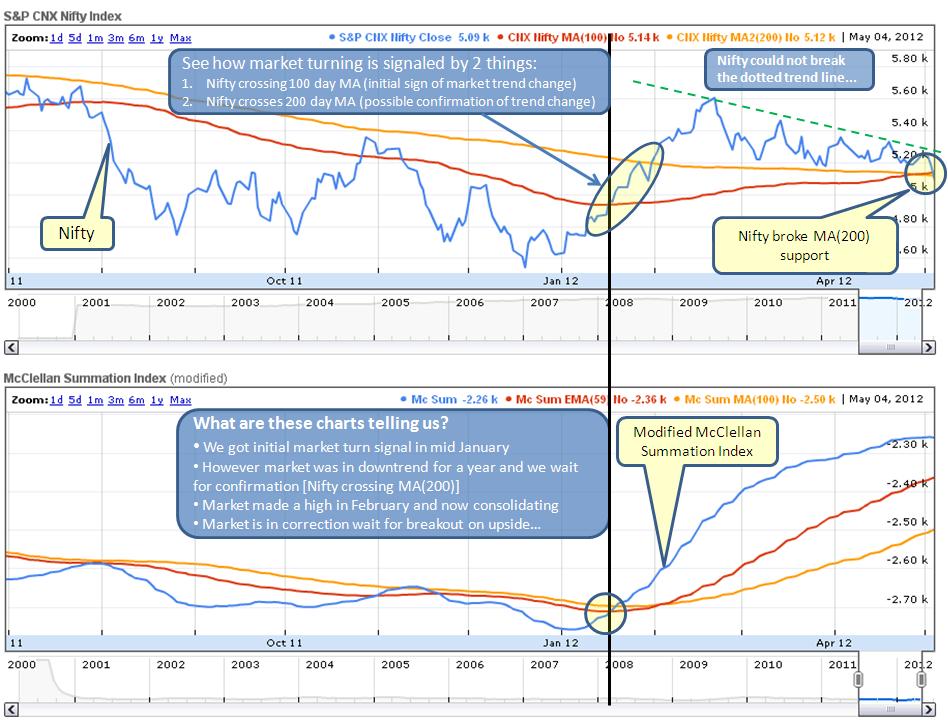
Take a look at below chart, does it tell us anything?
- Nifty seems to be dipping below MA(200) which means our support is broken
- Modified McClellan Summation line is still above its EMA & MA hence so far this looks like a correction and not trend change
- Nifty seems to be dipping below MA(200) which means our support is broken
- Modified McClellan Summation line is still above its EMA & MA hence so far this looks like a correction and not trend change
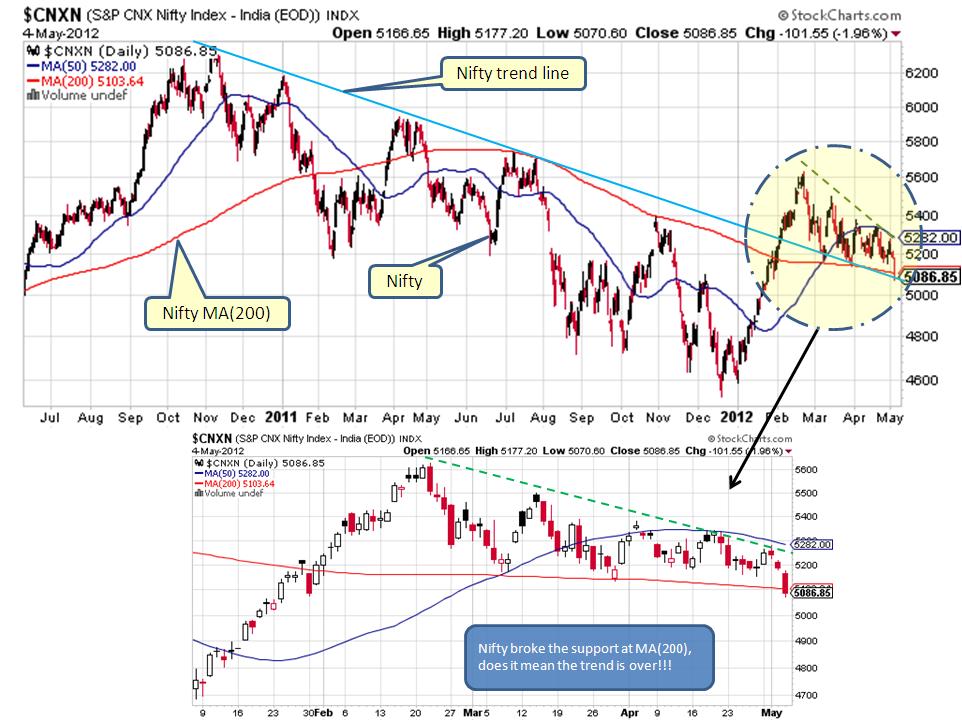
Below Nifty chart shows that by breaking the MA(200) and MA(100) support, this correction might be deeper than expected. So far the correction is close to 11%. How far Nifty may go down before turning around? It is difficult to measure that but possible scenarios might be:
Scenario 1st seems less likely while 2nd seems more likely, WHY? 1st scenario will certainly break the current UP trend and market may continue to go down until it re-test the previous lows near 4600. 2nd scenario is more likely scenario for the mere fact that during the UP trend volume was higher while the volume during correction has been lower, which tells us that this is not PANIC selling. Market may very well spend sometime below support line and then snap back and continue the UP trend...
- Nifty may simply test the 4600 level again forming "double bottom" pattern formation over next 2-3 months
- Nifty may simply spend few more days below the support line and then snap back right up again after government comes up with a plan for Mauritius tax treaty thereby making things clear
Scenario 1st seems less likely while 2nd seems more likely, WHY? 1st scenario will certainly break the current UP trend and market may continue to go down until it re-test the previous lows near 4600. 2nd scenario is more likely scenario for the mere fact that during the UP trend volume was higher while the volume during correction has been lower, which tells us that this is not PANIC selling. Market may very well spend sometime below support line and then snap back and continue the UP trend...
Remember, Markets don't care what anyone thinks or does! Market tends to always do things which causes "maximum" pain to all. Hence a good risk management is the KEY to success in trading. Understanding where markets may make there next move may provide you with an edge but being over confident about your predictions will certainly land you in deep losses.
Stay alert and be cautious...
Stay alert and be cautious...

 RSS Feed
