Market is in NO mood to show any weakness so far, so does it mean we are out of the woods! Is the next bull rally started and we missed the initial lift off from the bottom! OR we shall wait for a pullback! and Will it ever happen?
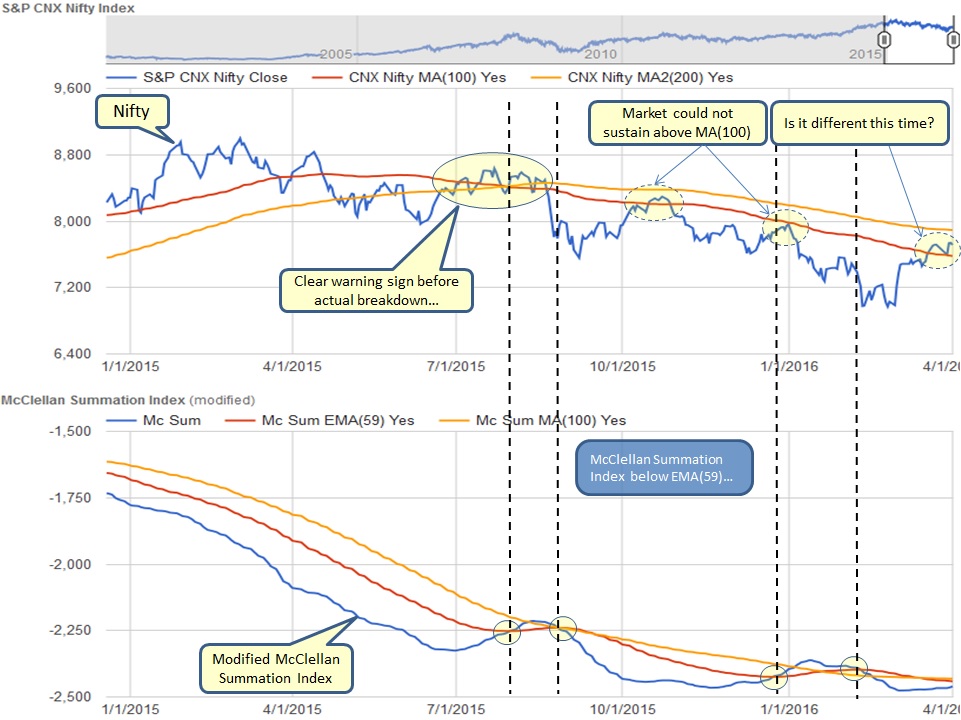
What is below chart telling us?
- Nifty just crossed MA(100) - Looks promising for a market turn around but check out what happened last two times (shown by dotted circles on the chart), also lets not forget that MA(100) is below MA(200)
- McClellan index remains below EMA(59) and remains flat inching upwards - For a sustained BULL rally, this index has to move above EMA(59) which would suggest more stocks are advancing than declining in cumulative fashion
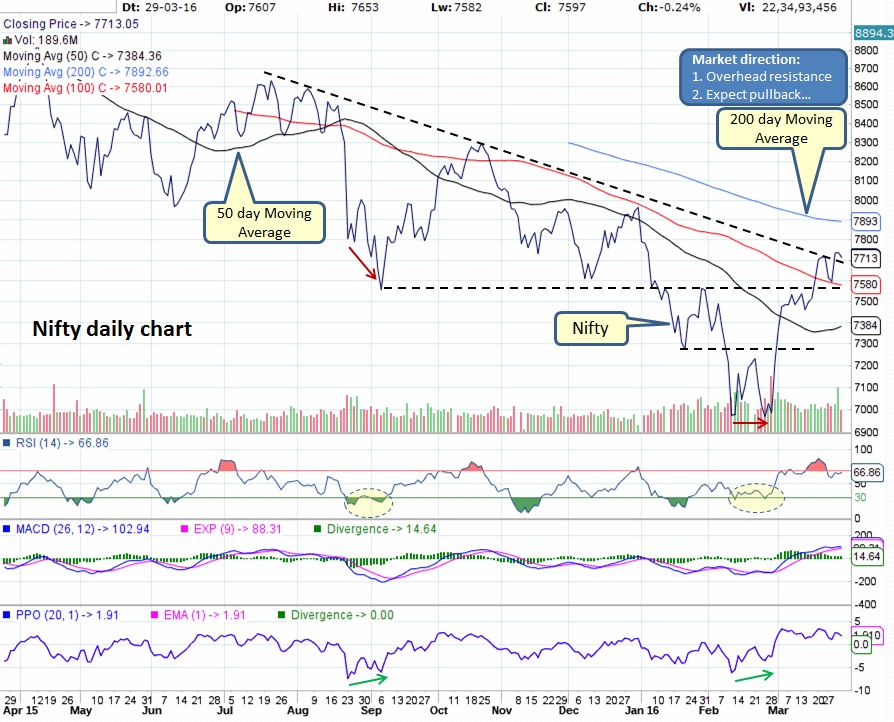
Daily Nifty chart below shows that the downtrend line is broken, in other words possibility of a trend change is probable. However, watch subtle clues in this chart:
- MA(200) resistance looms ahead near 7800-7900 area
- PPO appears to be forming divergence with Nifty suggesting a possible pullback ahead
Weekly chart does show that market is in resistance zone, however RSI has yet to decisively cross the down trend line and PPO did manage to break above the down trend line for now suggesting mixed signals.

Charts are telling us to have patience as market appears to be in resistance zone and most likely to experience a sideways action or pullback. The magnitude of the pullback will decide if this market is ready for the next BULL run. Hence it will be wise to be patient and wait for next low risk opportunity.
What does it mean for our Investments for now?
Try our Service -
Take a look at our service called "Quick Charts" which offers an easy visual way to look at daily and weekly charts of chosen stocks side-by-side. We hope it helps you in your research.
Market in resistance zone, stay alert...
What does it mean for our Investments for now?
- Mutual Funds - If still invested in equities then time to hold onto this roller coaster ride, exiting now will be very expensive and painful. No need to rush to start SIP unless we get positive trend reversal sign. If in cash/ FDs/ liquid funds then it is wise to stay on sidelines until we get confirmation.
- Stocks - ONLY invest in strong patterns with good earnings guidance and DO NOT forget to have STOP LIMIT on open positions. When market is in correction, it will drag everything down with it. Check out our trade size calculator to manage your risk along with potential buy candidates watch list.
Try our Service -
Take a look at our service called "Quick Charts" which offers an easy visual way to look at daily and weekly charts of chosen stocks side-by-side. We hope it helps you in your research.
Market in resistance zone, stay alert...

 RSS Feed
