Market continues to rally on all cylinders, but can this continue at current pace!!! Can we identify a potential slowdown ahead or even possibly a pullback chance!!! Let's take a look at the charts...
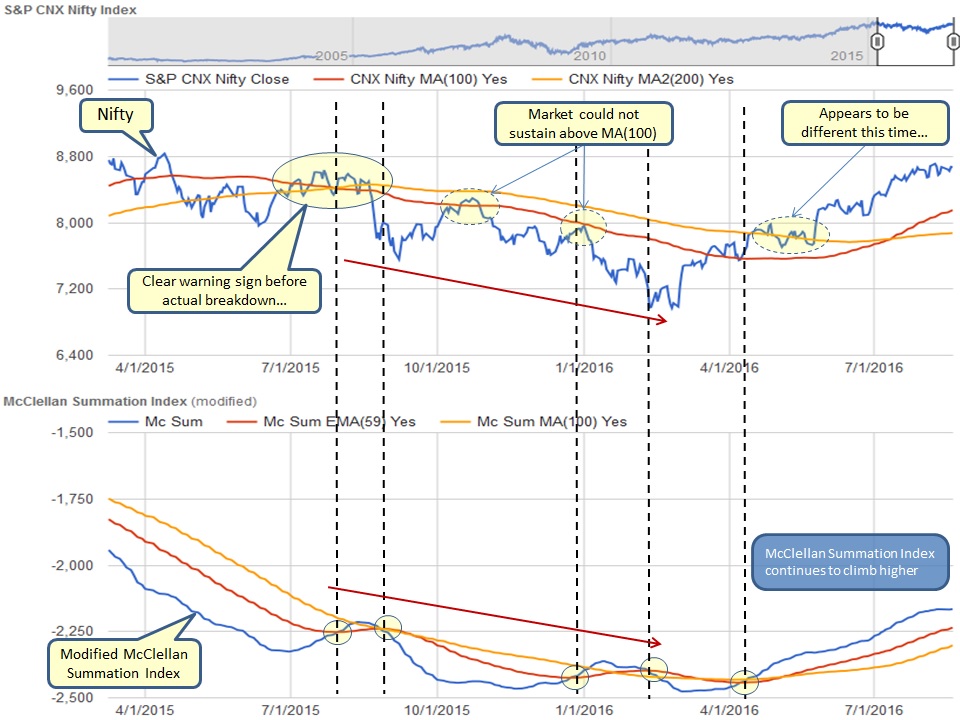
Below chart is providing two important clues, can you identify them?
- Nifty has managed to stay above MA(100 for quite sometime, however observe the distance between Nifty and MA(100). This certainly cannot go on for long and at some point Nifty will have to converge towards MA(100), BUT WHY? It is simple rule of statistics, everything has to revert back to mean at some point. We expect this market to do the same in next couple of weeks.
- McClellan Index remains very strong suggesting this recovery is real and as long as it stays above or near EMA(59) nothing to worry for now.
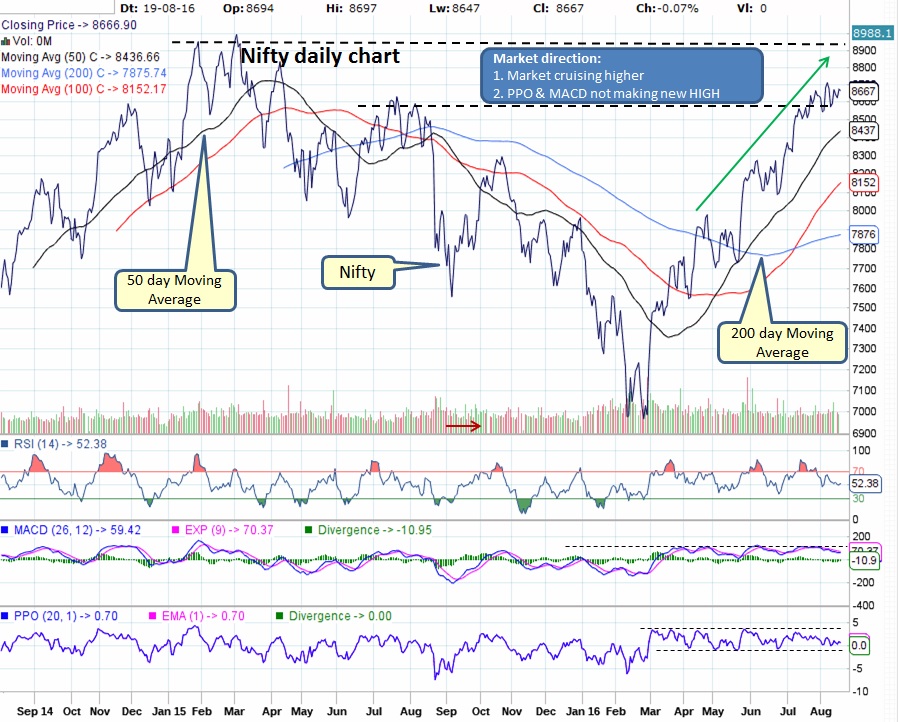
Daily Nifty chart is also providing two important clues:
- Market near all time high which means it shall experience resistance as it approaches previous HIGH.
- Watch MACD and PPO, both are not making NEW HIGH and remain in narrow range and can possibly turn downwards.
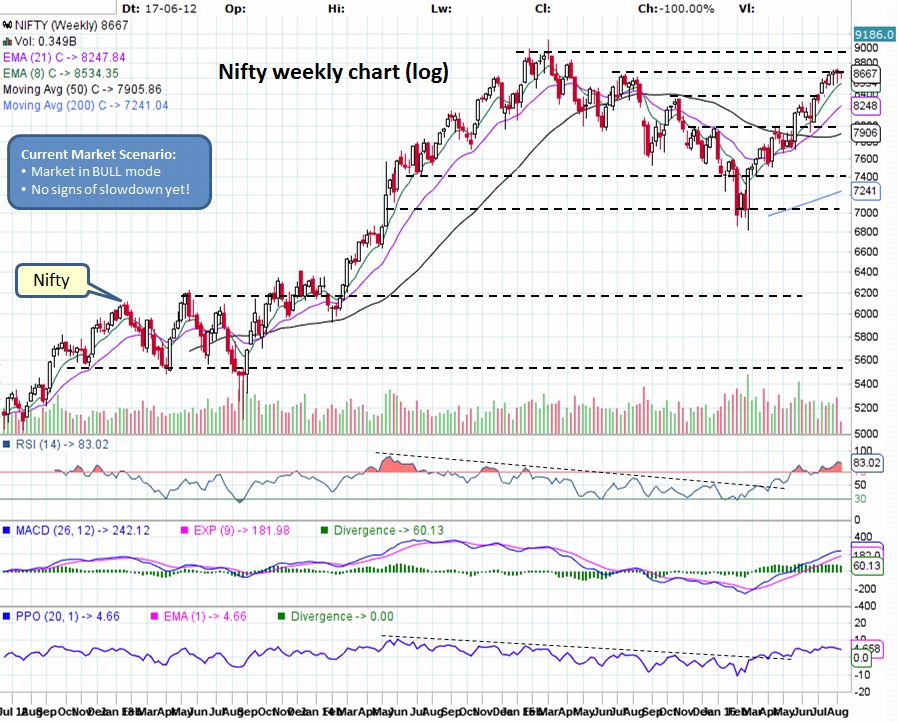
Weekly chart remains strong, however market is in overbought territory but can remain like this for a while.
Charts are telling us to be cautious as even though market might continue its rise, entering now does not favor a better risk to reward ratio.
What does it mean for our Investments?
Market in strong BULL trend....
What does it mean for our Investments?
- Mutual Funds - If still invested in equities then time to relax, as market has turned around. Continue SIP as market remains in strong bullish trend. If in cash/ FDs/ liquid funds then might be wise to wait for a pullback.
- Stocks - ONLY invest in strong patterns with good earnings guidance and DO NOT forget to have STOP LIMIT on open positions. Check out our trade size calculator to manage your risk.
Market in strong BULL trend....

 RSS Feed
