In last two weeks market has managed to recover in V-shape pattern. It does appear that correction is over for now BUT is this rally sustainable!!! What shall we expect in near term?
What is below chart telling us?
As mentioned earlier in our past weekly post, we might be witnessing a topping pattern, such pattern take 3-6 months time frame to evolve and are visible/confirmed ONLY after the facts. However this is just a probability and NOT a guarantee. As long as Nifty remains near MA(100) we will give benefit of doubt to trend continuation.
- Nifty is back above MA(100) and as long as it stay near it, the benefit of doubt remains with BULLs
- McClellan Index continues to remain below EMA(59) and MA(100), however it appears that the rate at which Index line was dropping has slowed down (this suggests that less stocks are declining as compared to earlier and more stocks are attempting to advance)
As mentioned earlier in our past weekly post, we might be witnessing a topping pattern, such pattern take 3-6 months time frame to evolve and are visible/confirmed ONLY after the facts. However this is just a probability and NOT a guarantee. As long as Nifty remains near MA(100) we will give benefit of doubt to trend continuation.

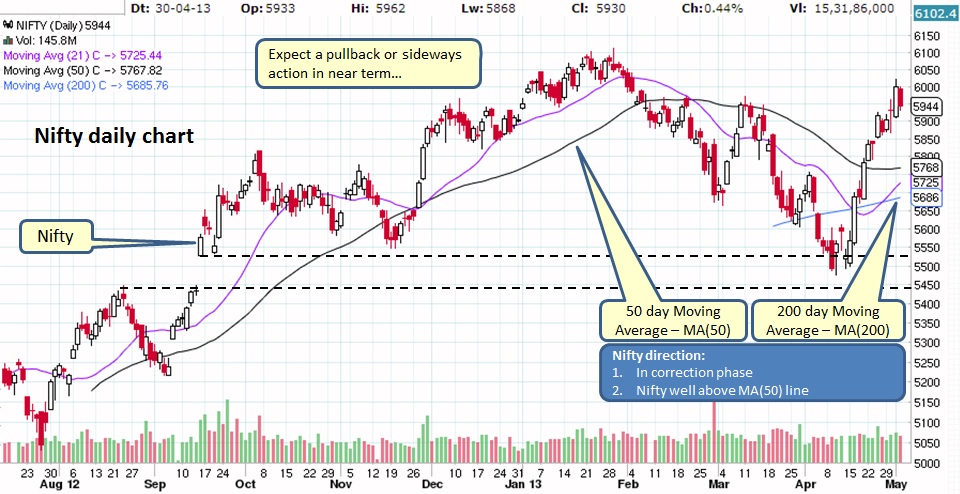
The V-shape recovery is very clearly visible in below Nifty daily chart. Such rallies cannot be sustained for long and needs to stabilize for a healthy trend. Market needs to slowdown by having a small pullback or sideways action at this point.
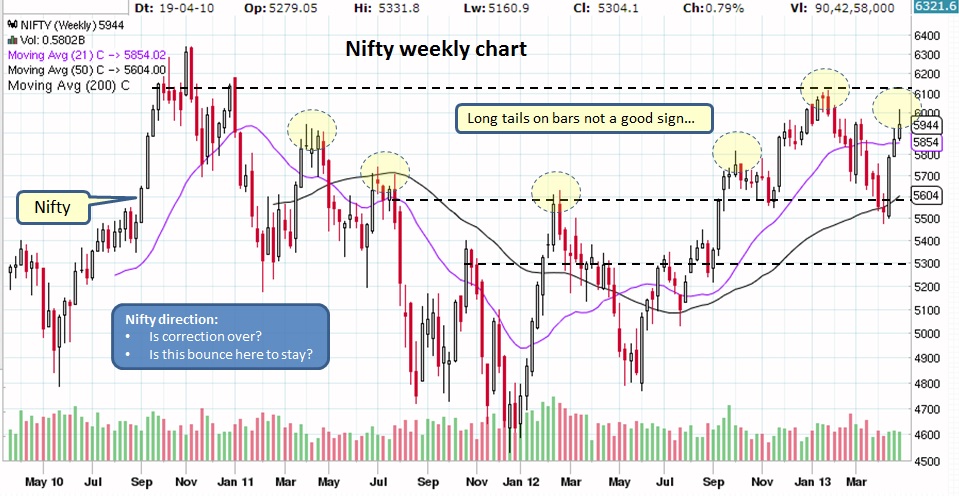
The weekly Nifty chart is telling a different story. Take a look at yellow dotted circles, Is it telling us something!!! Every time we see this pattern the likely hood of pullback is high, should it be any different this time?
What does this mean for our Investments?
Market appears to recover from correction but needs more stabilization...
- Mutual Funds - Stay invested, it is wise to wait n watch.
- Stocks - Take partial gains on good positions while ensure STOP LIMIT on remaining.
Market appears to recover from correction but needs more stabilization...

 RSS Feed
