Last 8 months run has come to an end as market managed to break the trend line as well as crossed MA(50) line. Does it mean that the rally has come to an end OR this is just a normal correction! ONLY time will tell but what to expect next?
Not much has changed in below McClellan Index chart.
- Nifty is converging to wards MA(100) line yet remains above it
- McClellan Index has managed to cross both EMA(59) and MA(100) lines suggesting to be cautious

Nifty daily chart below displays that Nifty broke its trend line as well as MA(50) line. It might find support near 5800-5850 area and possibility of a bounce. However, MA(50) line could act as resistance for the bounce attempt.

On weekly chart below, Nifty appears to be resting near previous support area and could also find further support near MA(21) line. We expect a bounce in few weeks at these levels.
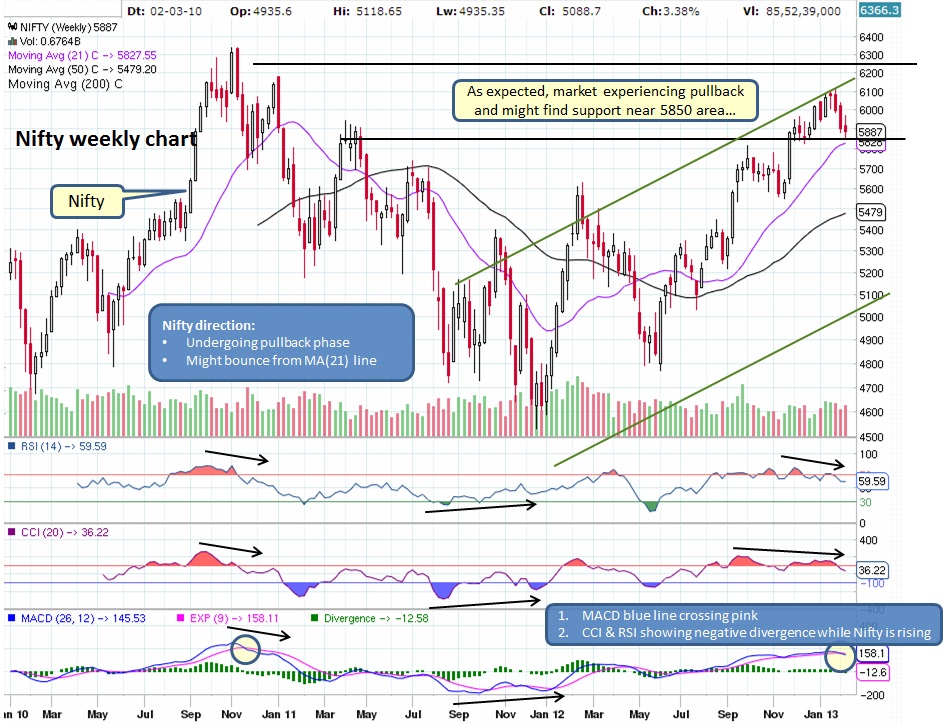
Most likely we shall see a bounce attempt which shall reach our original target area of 6200-6300 area where it will find significant resistance. However we should be cognizant about the fact that a possibility of breakdown is also an option. But our system will provide us with appropriate signal and we will have plenty of time to react before the actual breakdown happens.
What does it mean for our Investments?
Market is undergoing pullback, hence remain cautious...
What does it mean for our Investments?
- Mutual Funds - As of now stay invested but be cautious.
- Stocks - Invest in right patterns and DO NOT forget to have STOP LIMIT in place. Visit our watch list for some ideas.
Market is undergoing pullback, hence remain cautious...

 RSS Feed
