As expected market continues to march higher BUT how far and how long!!! What key signs should we be looking at!!!
Do you find anything new in below chart?
- Nifty remains above MA(100)
- Watch McClellan Index, it is converging towards EMA(59), as long as it remains above the red line nothing to worry about but if falls below that line then its time to be cautious

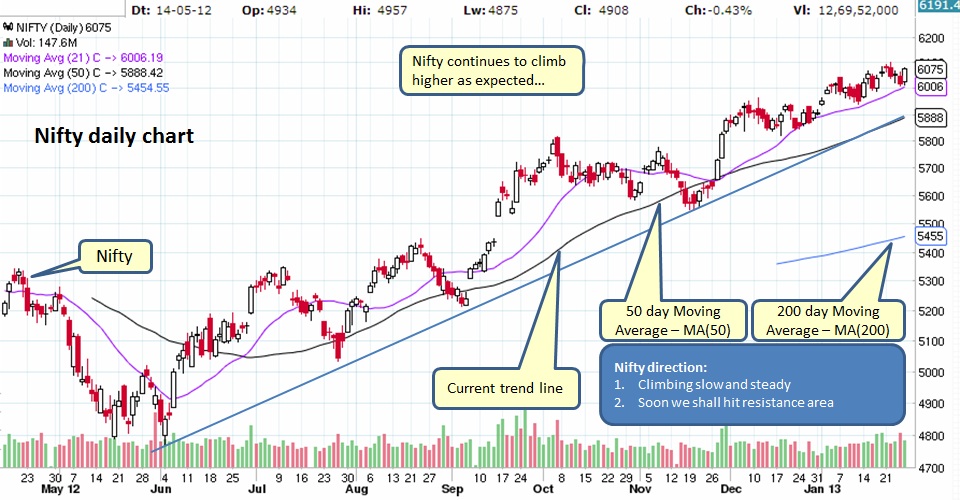
Daily Nifty chart below continues to remain bullish for now and stays above the trend line.
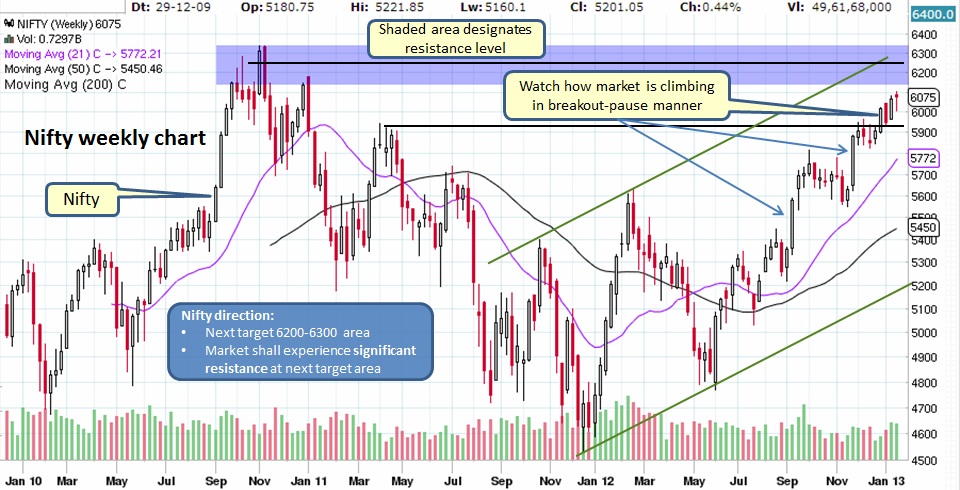
On weekly chart below, we can see shaded area which will be resistance area for Nifty. Expect Nifty to reach that level in next couple of weeks.
What does it mean for our Investments?
Market remains bullish...
- Mutual Funds - Stay invested as we do not see any signs of concern for now.
- Stocks - Invest in right patterns and take partial profits, always have STOP LIMIT in place.
Market remains bullish...

 RSS Feed
