Market is very close to ALL TIME HIGH but can it sustain these levels and break through to make NEW HIGHS!!! What do you think will happen in near term? Let's find out if charts are providing any clues...
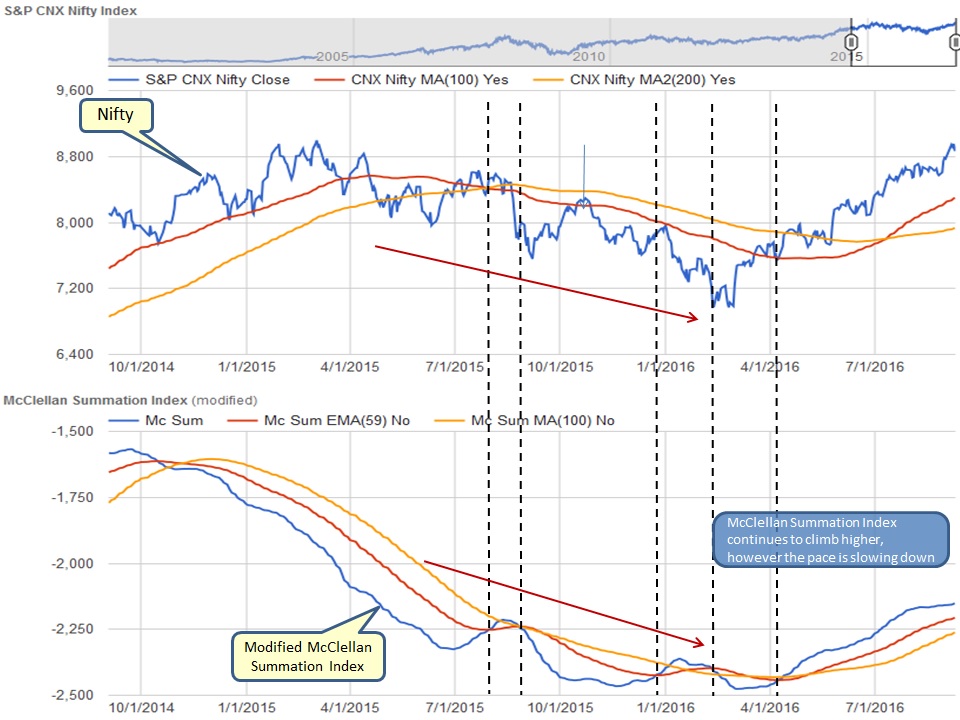
A very clear slow down in the rising pace of McClellan Index is visible in below chart and we were expecting this for quite some time. We expect this market to pullback all way back towards MA(100) and might even marginally break through that level to spook everyone.
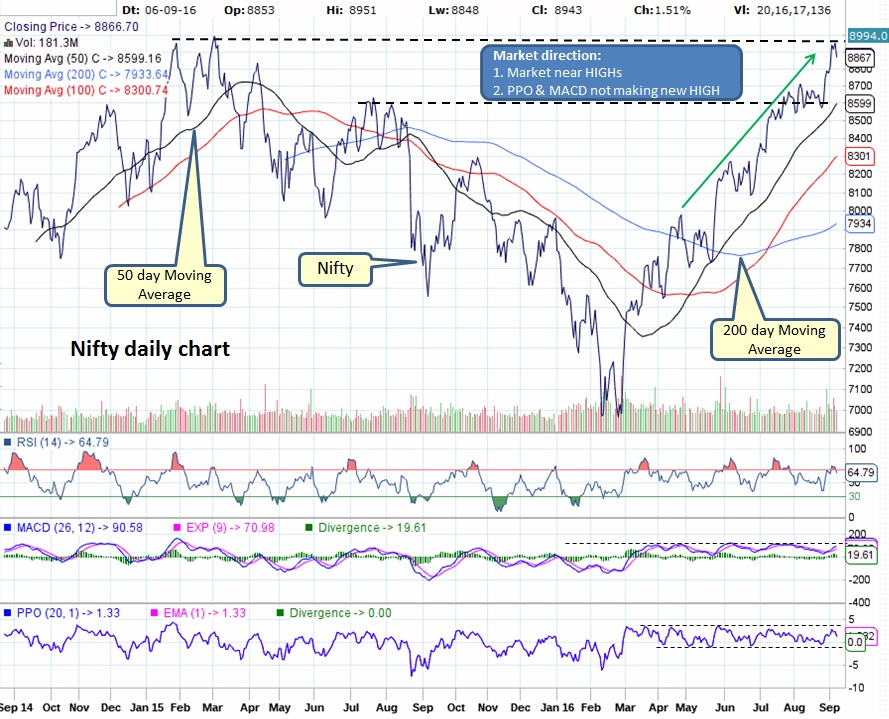
As mentioned earlier, daily Nifty chart displays that MACD and PPO are not making NEW HIGH and stuck in a range while RSI appears to have touched overbought level.
Weekly Nifty chart shows a long top tail on the last bar suggesting possible start of pullback.
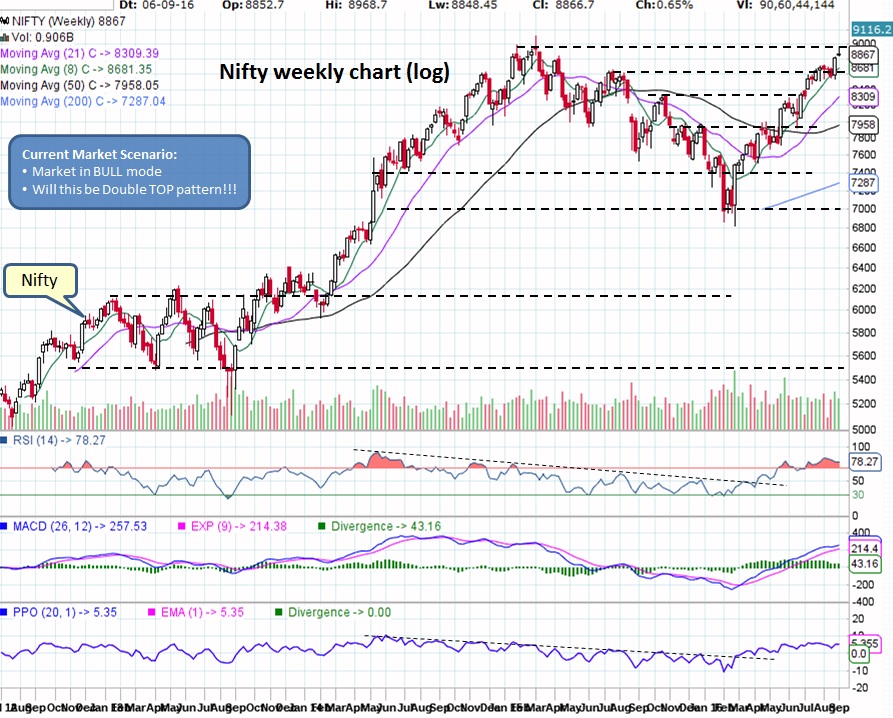
We expect market to undergo pullback after such a stellar run and V-shape recovery, however the magnitude of pullback will determine if this pattern will become double top (considered bearish) or cup and handle(considered bullish). Only time will provide evidence but the whole process might take couple of weeks or even 1-2 months.
Market remains very bullish for now, but be cautious...
Market remains very bullish for now, but be cautious...

 RSS Feed
