Market is making yet another HIGH, but can it sustain this for long!!! Expect some consolidation after several days of rally, BUT WHY? What are charts telling us?
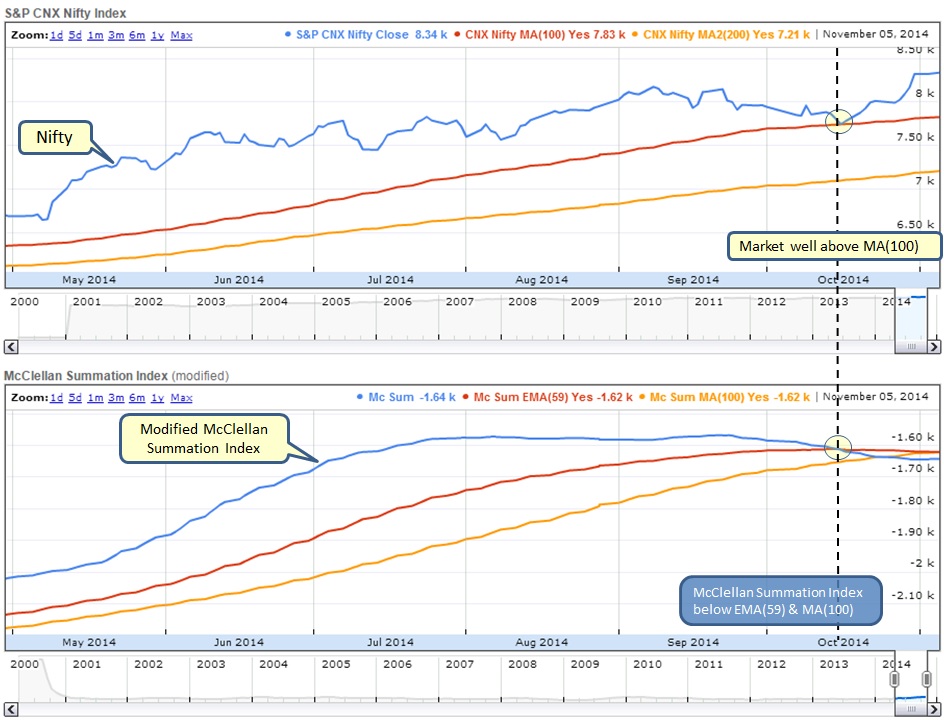
Nothing changed in below chart:
- Nifty well above MA(100) suggesting bullish trend
- McClellan Index is however below EMA(59) and MA(100) but managed to stay flat, while MA(100) appears to be crossing EMA(59) - this is suggesting that more stocks are decling than advancing hence be cautious
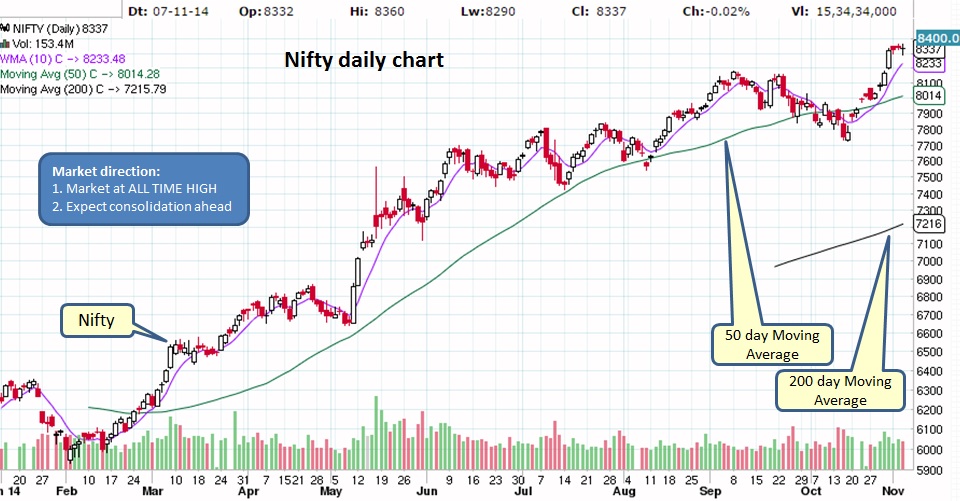
Market is at NEW HIGH after several days of rally which can be seen in below chart. Typically market digest the gains after such a rally by moving sideways in a range or shallow pullback.
Weekly chart looks bullish with market at ALL TIME HIGH.
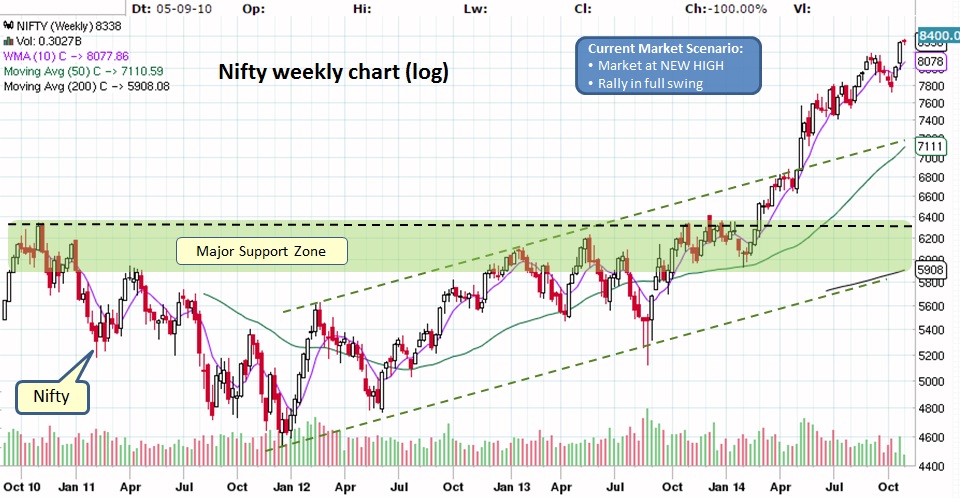
Since market is at all time high does NOT mean that it will continuing doing so. Always look for low risk entry and now may not be the right time to get in as your risk will be high. As long as market remains above MA(50) on daily chart and WMA(10) on weekly chart consider this market in bullish mode.
What does it mean for our Investments?
Market continues to remains in bullish territory...
What does it mean for our Investments?
- Mutual Funds - If invested in equities then continue to remain invested and same would apply to SIP. If in cash/liquid funds/FDs then wait for next low risk entry.
- Stocks/ETFs - Look for good patterns with low risk entry, check out our watch list for good candidates and trade size calculator to manage your risk.
Market continues to remains in bullish territory...

 RSS Feed
