Market has managed to move in a very narrow range in last 3 weeks and yet remain very close to recent HIGHs. What is it telling us? Can we find subtle clues!!! Is this the right time to enter?
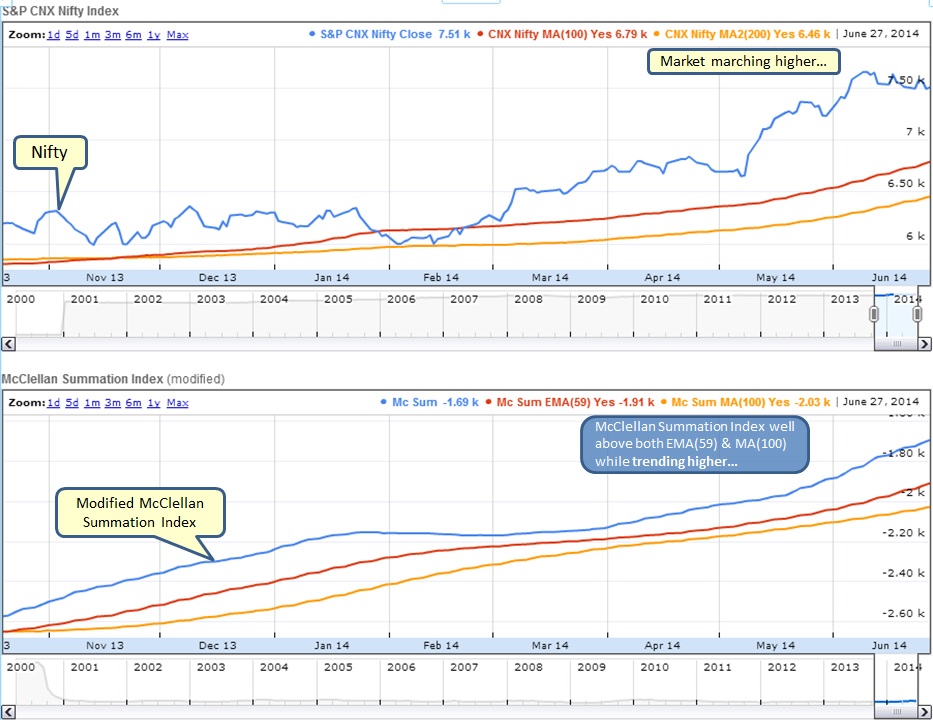
Not much has changed in below chart and all signs remain in strong bullish trend.
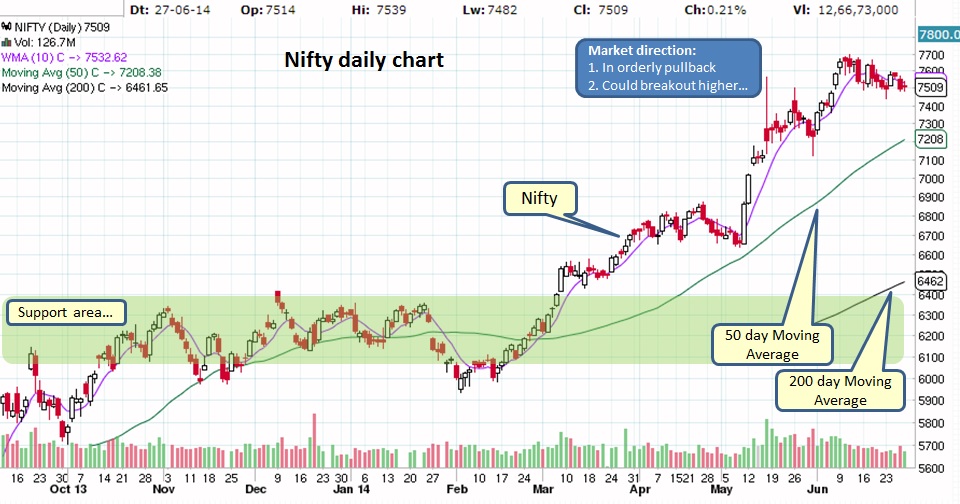
A very orderly pullback can be seen on the daily chart below, also take a note of declining volume in recent days. This is a classic bullish chart pattern known as BULL FLAG.
On weekly chart, it is very clear that market is moving in a narrow range ad having an orderly pullback while volume is declining in last 3 weeks. A breakout above last weeks HIGH (around 7600 area) is an excellent entry point with a STOP below last weeks LOW.
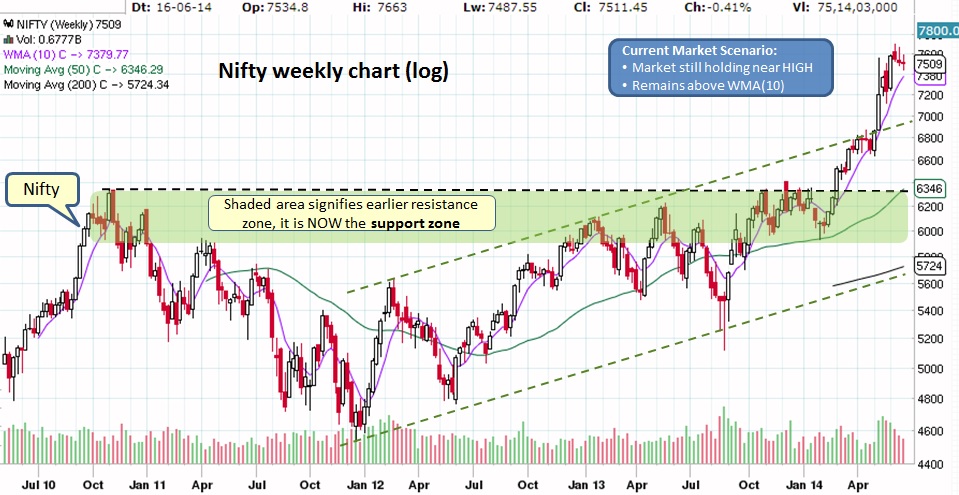
As expected market continues to remain above WMA(10) and any pullback to WMA line will provide an opportunity for low risk entry.
What does it mean for our Investments?
Market remains in strong bullish trend...
What does it mean for our Investments?
- Mutual Funds - If invested in equities then stay put and enjoy the gains. If in debt funds then continue to remain invested as FIIs are buying heavily in perceived growth due to new government. If in cash/FDs/liquid funds then this might be your low risk entry, time to think and act.
- Stocks - ONLY invest in strong patterns and use trade sizing tool for risk management.
Market remains in strong bullish trend...

 RSS Feed
