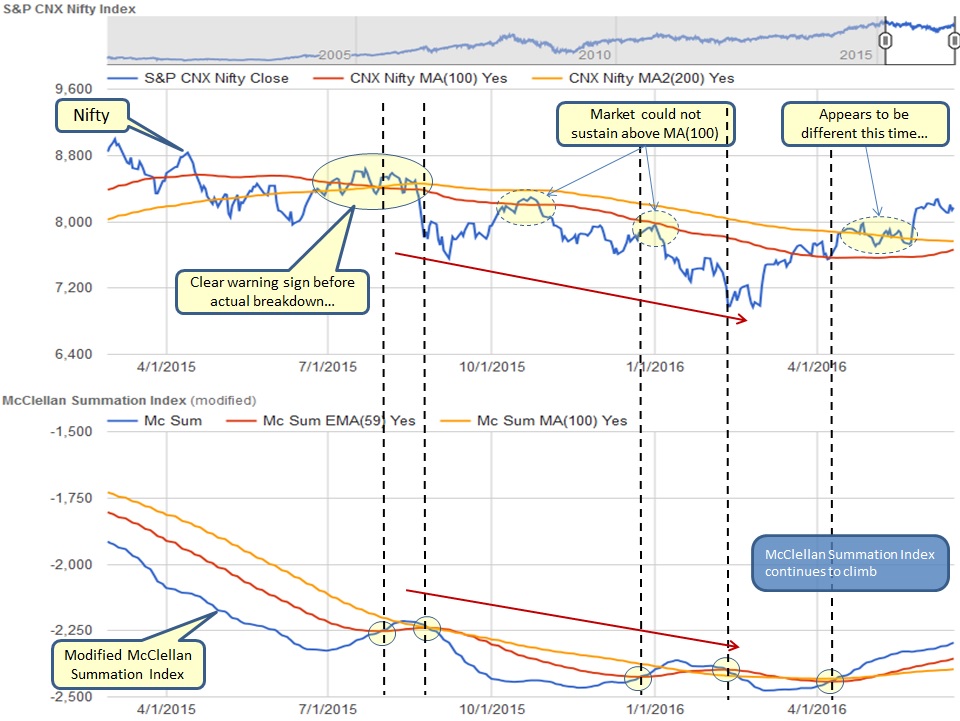
After breakout above MA(200), market has managed to stay near recent HIGHs but is it sustainable!!! Are charts providing any clues at this juncture! Lets take a look....
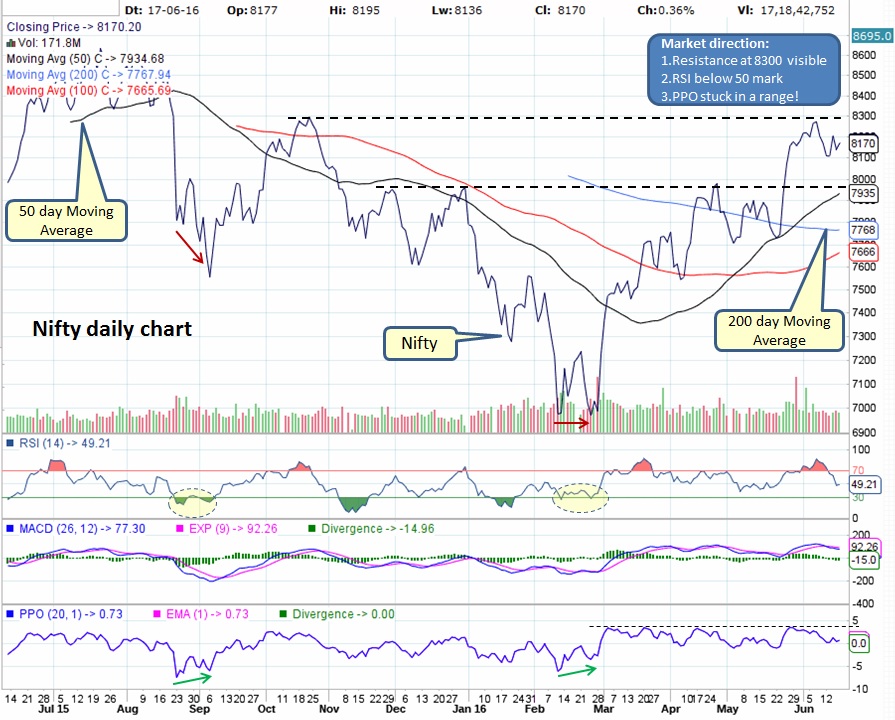
Not much has changed in below chart, so far all signs are positive.
Resistance near 8300 area is visible in below Nifty daily chart. RSI has dropped below 50 mark as market has retraced a bit allowing it to cool off the overbought condition.
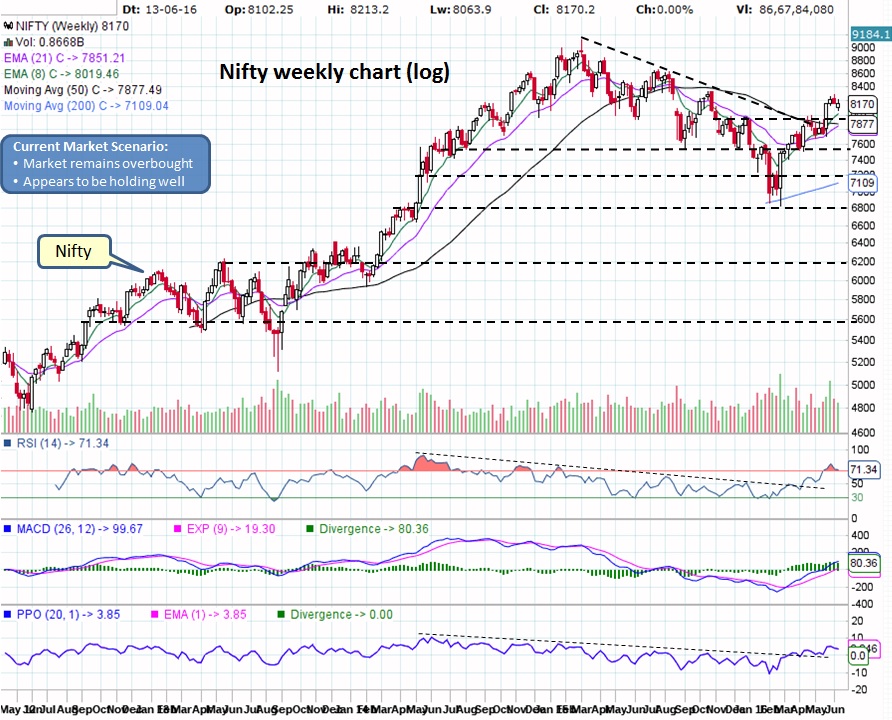
Weekly chart suggest that we might see some sideways action as RSI is in overbought territory.
Global uncertainty due to BREXIT vote will cause volatility to rise next week. This is precisely the time to find potential candidates which can provide better returns once the BULL run gets going.
What does it mean for our Investments?
Market is holding well but remain alert...
What does it mean for our Investments?
- Mutual Funds - If still invested in equities then time to relax, as market appeared to have turn around. Starting SIP would be a good idea as we see confirmation of positive trend reversal. If in cash/ FDs/ liquid funds then it is time to start investing. If you are waiting for pullback then you might be waiting for long or might even miss the train.
- Stocks - ONLY invest in strong patterns with good earnings guidance and DO NOT forget to have STOP LIMIT on open positions. When market is in correction, it will drag everything down with it. Check out our trade size calculator to manage your risk.
Market is holding well but remain alert...

 RSS Feed
